The decline in global supply of platinum (PGMs) over time has become a clear and ever-present danger to global decarbonisation efforts in the short and medium term, at least. I believe the decline in global platinum mine supply has not been given the attention it deserves by some industry research organisations and investors; after all, the market balance equation relies on both supply and demand. These organisations seem to ‘shy away and/or are intransient’ about this subject and focus mainly on the demand side of the supply-and-demand equation. Potential investors are missing this key piece of information, which ought to be “factored in” when considering a medium to longer-term investment decision on platinum. A deficit in the market balance will put significant upward pressure on the price of platinum.
This review focuses on the future quantum of global PGMs and platinum mine supply together with the heightening risks associated with their supply. Note that South Africa, Russia and Zimbabwe represent around 73%, 10% and 8% of global platinum supply, respectively. In this regard, it is immediately obvious that circa. 91% of the world’s platinum supply comes from just three countries. This geographical and political concentration of supply can be described as ‘precarious’ at best. It is noted that global mining is not without risk. However, PGM and platinum mine production faces additional existential risks and I refer to these “additional existential risks” in this report. For South Africa, one of many additional existential risks is the looming and potentially catastrophic energy crisis.
Notwithstanding the medium to long-term decline in PGM grades and hence a decline in supply from South African platinum mines over time, Nornickel has announced that it cannot guarantee 2023 production targets. Furthermore, I am of the view that Nornickel’s expansion/ refurbishment pipeline programme between 2024 and 2031, of which
there are many, will be severely hampered by supply chain constraints and the lack of spare parts. Under these circumstances, it is reasonable to expect a downturn in PGM supply from Russia.
South Africa has faced chronic power supply shortages from its power utility Eskom for over 10 years. The current year has been the worst yet, and this is evident from several studies highlighting the deterioration of Eskom’s fleet as power stations are shut down and demand grows. Eskom has concluded that enforcing the National Environmental Management: Air Quality Act, 2004 (MES) will be catastrophic to the operability of the power system, given the quantum of capacity impacted by the MES decision. This begs the question, what will to happen to the promises made to COP 26 and COP 27? There is also a significant risk that Koeberg (South Africa’s nuclear power station) will be severely constrained with the shutdown of Unit 1 on 8 December 2022 for at least six months, Unit 2 will be shut down thereafter in accordance with the Koeberg 40-year life of plant (2024).
To add fuel to the demise of Eskom power generation supply, Eskom suffers from a chronic grid connection capacity constraint, which is a limiting factor for connecting new generation from areas with the best solar or wind resources.
The ongoing load-shedding has impacted South Africa’s platinum mine production negatively and will continue to do so as the frequency and duration of load-shedding accelerates, resulting in a complete and catastrophic shutdown of mines, and negative repercussions for future investment. Note, the CEO of Eskom recently voiced this load-shedding scenario. Furthermore, the shutdown of platinum mines for extended periods will have an enormous impact on global mine supply.
This review maps the demise of Eskom’s coal-fired power plants in the
simplest way possible with the use of cause-and-effect graphics. The conversation then describes relevent definitions and the operational environment, which will enlighten and give colour to the reader’s understanding of the various stages of load-shedding. The objective of this discussion is to provide undertstanding between the different load- shedding stages and their impact on platinum mine supply. Therafter, the discussion moves on to the likely decline in supply of both platinum and palladium from Russia.
Relationship between a decline in power supply and its impact on PGM mine supply
It is important to note that the relationship between a decline in power supply and its quantum of impact on PGM mine production cannot be measured directly because of the complexities surrounding this calculation. Furthermore, the effect of load-shedding cannot be exactly extrapolated to other PGM mines, as each mine has structural and complex differences that need to be considered; for example, compare open cast, shallow and deep mines. Much depends on the load-shedding protocol adopted to take these differences into account The frequency and level of load-shedding stages can, however, be measured. This leaves us with a series of “estimated probabilities” and “best estimates” taken from previous load-shedding experiences (frequency and duration) about the likely impact on PGM mine supply. It should be noted that the duration of load-shedding will likely rise to between 250 and 300 days at least, between 2023 and 2027, as ageing coal-fired power stations are taken off line with insufficent power generation from green energy sources to neutralize the energy gap.
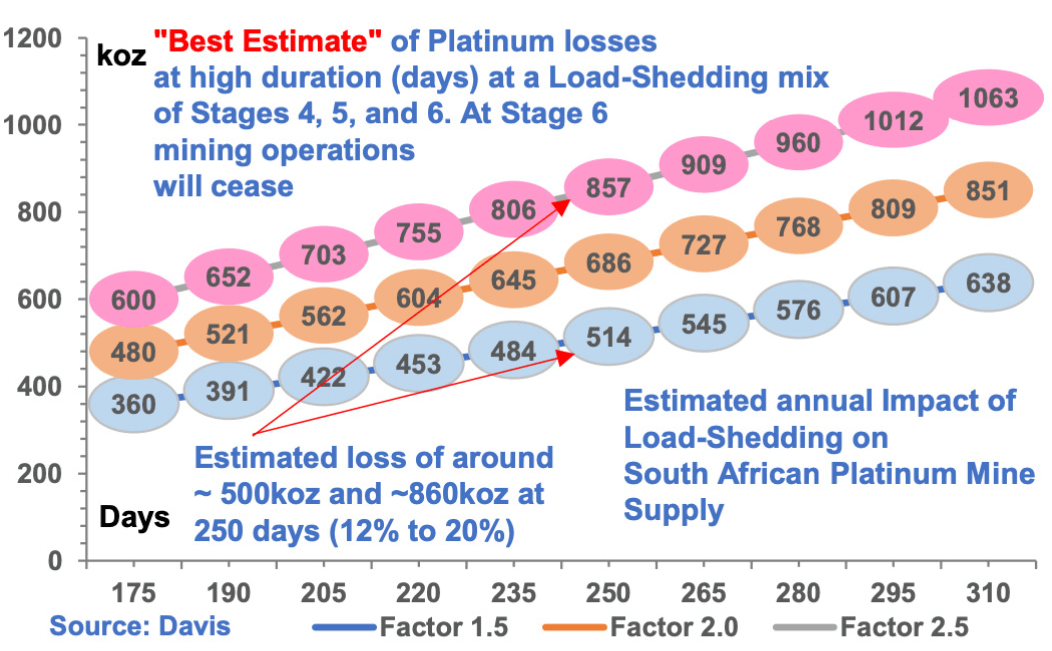
Figures 1, 2 and 3 illustrate my conservative “estimated” annual impact
of load-shedding on South African platimum mine supply, which will likely be between 2023 and 2027, at least. The figures are a best estimate of platinum, palladium and rhodium losses: at high duration (days), at a load-shedding mix of Stages 4, 5 and 6. At Stage 6, mining operations will effectivey cease. For example, at 250 days duration with high load-shedding rates the loss in platinum is estimated around ~860koz and ~500koz.
Figure 1.
The projected estimated loss in platinum mine supply from South Afria represents around ~12% and ~20% at Factor 1.5 and Factor 2.5 respectively. The projected estimated loss in global platinum supply represents around ~9% and ~15% at Factor 1.5 and Factor 2.5 respectively
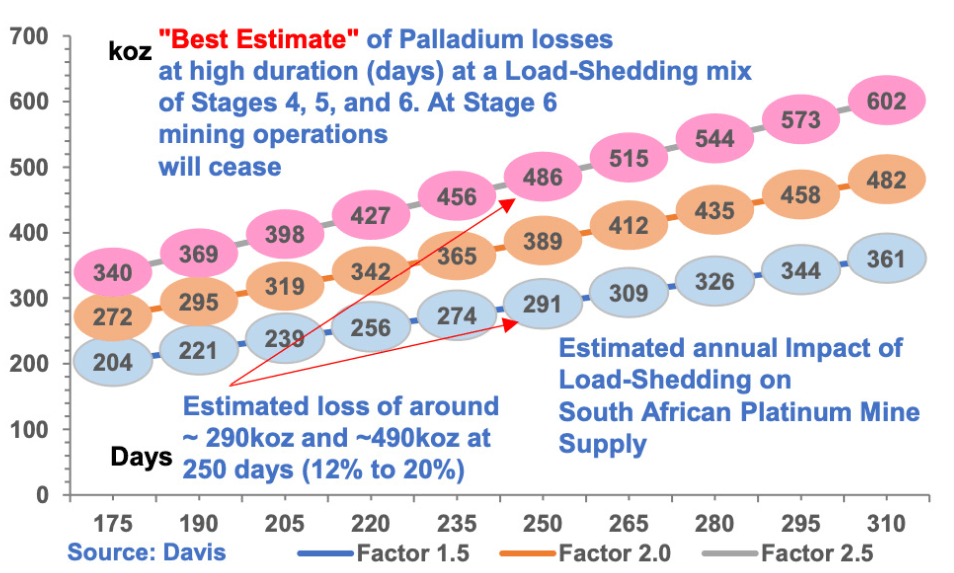
Figure 2.
The loss in palladium is estimated around ~290koz and ~490koz.
The projected estimated loss in palladium mine supply from South Africa represents around ~12% and ~20% at Factor 1.5 and Factor 2.5 respectively. The projected estimated loss in global palladium supply represents around ~4% and ~7% at Factor 1.5 and Factor 2.5 respectively.
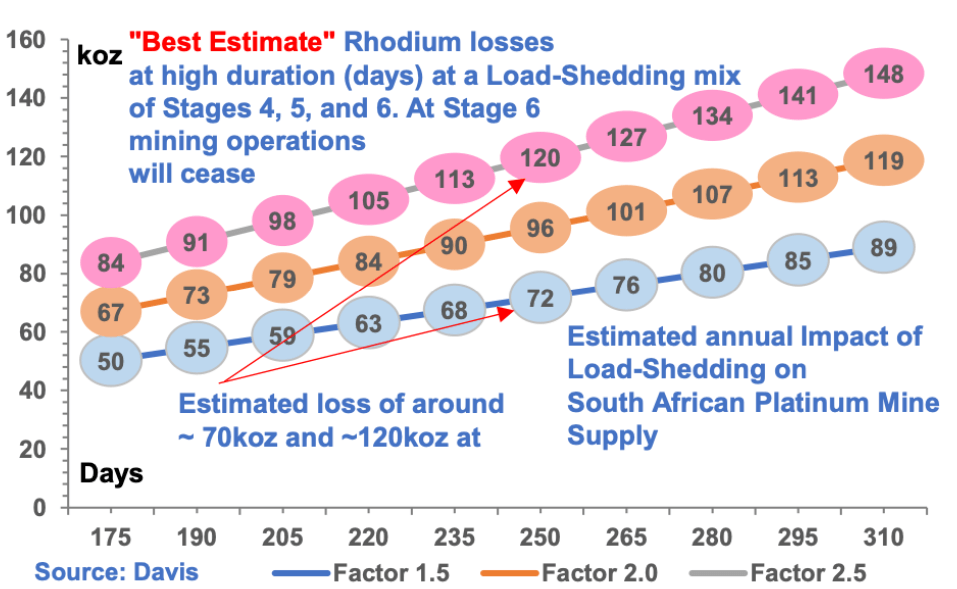
Figure 3.
The loss in rhodium is estimated around ~70koz and ~120koz. The projected loss in rhodium mine supply from South Africa represents around ~12% and ~20% at Factor 1.5 and Factor 2.5 respectively. The projected estimated loss in global rhodium supply represents around ~9% and ~16% at Factor 1.5 and Factor 2.5 respectively.
My “best estimates” surrounding the likely impact of load-shedding on PGM mine supply, in my view, are on the conservative side. The impact on the quantum of decline in mine supply of PGMs is significant and will be far reaching, touching every aspect of PGM demand in particular the supply and demand for platinum.
Under these circumstances, I expect a significant increase in mine platinum (PGM) inventories as well as a decline in supply over the period 2023 to 2027. The build-up in mine inventory will likely keep occuring; however, at some point during this period, smelters, converters and refining operations will likely be overwhelmed by the backlog of inventory, as these operations are temperature sensitive to extremes in power input. Futhermore, the unit cost of production will also likely increase exponentially resulting in a squeeze on margins. I also expect a “structural change” in the operations of the South African platinum mining industry to maintain equilibrium with power supply. This equilibrium will likely result in a decline in platinum mine supply and, as a result, put further pressure on the continuous decline in the platinum market balance deficit thereby forcing platinum to new price highs.
This operational situation is already unfolding
Miningmx reported (13 December 2022) that Natascha Viljoen, CEO of Amplats said “the commissioning of the newly rebuilt Polokwane smelter increased the company’s baseload against which to offset curtailments, it also had less flexibility in how it manages energy consumption at its other assets’’. As an intensive energy user, the company operates on the basis of load curtailment rather than timed power cuts as per non-
industrial load-shedding requirements. The equivalent Stage 4 load- shedding requires a load curtailment of about 20% in terms of National Energy Regulator of SA regulations. At higher levels of loadshedding intensive energy users are required to cut essential operations which can include refining or saleable production.
Viljoen went on to say “Amplats had lost a further 50,000oz owing to the most recent curtailments taking inventory levels to about 105,000oz of platinum group metals over the last two quarters, and that the impact of curtailments could worsen.
“In the last weeks there is more [curtailment] than what we have flexibility in the system for and have seen more of an impact on the operations. If we look at last week, we have had to stop Mogalakwena”, referring to the firm’s flagship mine. Power curtailment as well as the refurbishment of the Polokwane smelter and lower expected grades from Mogalakwena has resulted in an inventory build of about 350,000oz worth about R7bn in earnings before interest, tax, depreciation and amortisation assuming current spot prices.
It is important to note that almost all the facts in this review surrounding South Africa’s energy crisis come straight from Eskom’s reports and presentations, and from “The Medium-Term System Adequacy Outlook (MTSAO) for the period 2023 to 2027, 30 October 2022”. This MTSAO report is a generation assessment that measures the electric power system’s ability to meet demand over the next five calendar years within acceptable levels of reliability as defined by the adequacy metrics.
The MTSAO report, in my view, is supportive of my findings and views.
In this regard, the MTSAO report concluded that the:
“Power generation system adequacy outlook between 2023 and 2027 is deemed to be inadequate. The outcomes of this study also show that the envisaged new capacity (green energy) in the IRP 2019 emerging plan when completely rolled out, will not be enough to fully remedy the supply constraints at low EAF values”. These comments have come straight from the horse’s mouth – Eskom. The outlook looks bleak!
In my view, knowledge and concepts surrounding load-shedding and its impact on South African platinum mine supply is “key” to PGMs and especially to the platinum industry including research organisations. Alas, I have not seen any definitive publication in the industry on this subject, which informs the investor of the heightened risk and the consequences associated with South African mine supply. Although recently some of these organisations have noted a change in annual guidance of some South African platinum mining companies, which is not only attributed to power shortages but also to lower grade, infrastructure closures and challenging geological ground conditions. In this regard, a few research organisations have revised their 2022 forecast of primary supply of platinum (PGM) downwards but have left their future plans static. Most research organisations do, however, say
when predicting forward platinum mine supply: “subject to ongoing challenges and risks associated with South African mine supply in terms of power supply”. Many nevertheless, have recently changed their stance given that South African platinum miners are increasingly reporting the buildup of inventories due to a significant increase in the frequency of load-shedding, and the constant reporting of the energy crisis by government and news publications that are now saying Eskom poses a significant risk to platinum (PGM) primary mine supply. But they have not quantified this risk. It should be noted that Eskom has warned consistently that the duration of load-shedding at higher duration and frequencies will likely be the norm over the next five years, which will most certainly affect platinum (PGM) mine supply. It appears that none of these organisations picked up this most critical information.
I find these statements incredible as these organisations have not seen the “freight train” coming and, in my view, have ignored or missed the catastrophic impact on the industry and the primary and global supply of platinum (PGMs), particularly since South African power generation has already started to fall into disintegration, leaving the industry and investors hanging out to dry.
It is significant to note that platinum and global decarbonisation have become synonymous with platinum and green hydrogen. Just as platinum is inextricably linked to the introduction of vehicle emission standards, which have been progressively tightened through regulation worldwide since 1970, green hydrogen has now become a key pillar of decarbonisation for industry. (Auctus News, August 2022 “Platinum Supply – a Barrier to Global Decarbonisation in the Vehicle, Transport, and Industry Sectors”)
Closing the energy gap
In mitigation of the accelerating and looming crisis, the South African Government has drawn up a Just Energy Transition Investment Plan (JET IP) for the five-year period. The JET IP 2023–2027 sets out the scale of need and the investments required to support the decarbonisation commitments made by the government of South Africa and the governments of France, Germany, United Kingdom, United States (and the European Union (forming the International Partners Group (IPG) at COP26). In the context of the JET IP’s identified scale of need for investment in the priority sectors of Electricity, New Energy Vehicles (NEVs) and Green Hydrogen (GH2), the JET IP outlines how the IPG pledge of USD8.5bn will be allocated to these priorities in South Africa over five years, of which USD6.9bn will be allocated to electricity. The JET plan was formally handed to the IPG at COP27 in Egypt.
The newly appointed CEO of the Energy Council of SA, James Mackay, said in a recent interview “JET-IP was built on three asset pillars: decarbonisation by shutting down coal-fired power stations; establishing a green hydrogen sector; and the transition in the automotive industry to manufacturing electric vehicles. JET IP is a great step in the right direction, but it does not adequately cover where we need to get to. What the JET-IP does not address is the huge amount of work that will have to go into creating the type of integration needed at a systems and governance level to make a sustainable transition at a country level”.
Alas, and as expected, political wrangling and mismanagement have once again infiltrated the successful operation of JET-IP, which may well slip into the 2030s.
Resignation of Eskom’s CEO De Ruyter – another disaster in the making
To make matters considerably worse André de Ruyter recently resigned as Eskom CEO. De Ruyter said he no longer felt he had the “support of the broader political economy”, which he described as “absolutely critical to enabling the success of Eskom going forward”. In the weeks leading up to his resignation, De Ruyter was subjected to a series of escalating political attacks and threats, Mineral Resources and Energy Minister Gwede Mantashe for example, accused the Eskom CEO of treason.
It is understood that De Ruyter’s resignation could lead to the departure from Eskom of several other senior executives and engineers. Jan Oberholzer, De Ruyter’s number two and the chief operating officer, will retire in April 2023.
Definition of load-shedding
Load-shedding is a controlled way and legal requirement to make sure that the national grid remains stable in case of major incidents. Load- shedding is implemented to avoid a total countrywide blackout. There are 8 stages of load-shedding. Stage 1 represents an energy gap of 1,000MW which must be shed, Stage 8 represents an energy gap of 8,000MW which must be shed.
Load-shedding has two main components 1) The amount of power which must be shed from the grid between Stage 1 and Stages 8 and 2) The number of hours (days) or frequency, which are shed by each stage respectively. It becomes obvious that at the higher Stages 4, 5 and 6 mining operations become severely impacted.
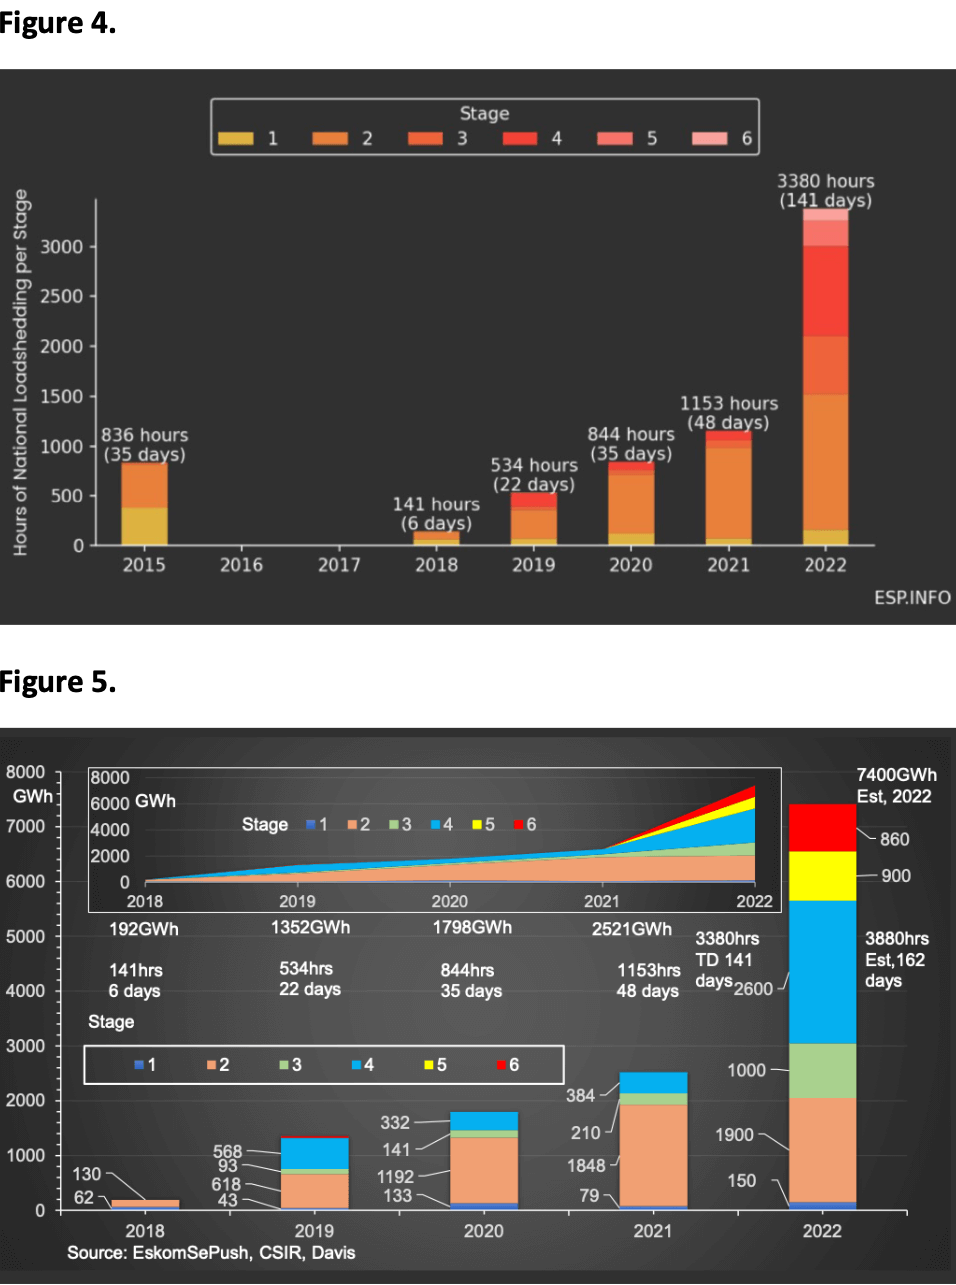
The South African platinum mine industry can “cope” with load- shedding Stages 1, 2, 3 and 4, albeit at Stage 4, at higher daily frequencies as experienced in the third quarter this year, it began to bite not only into production but also resulted in an increase in the work-in-progress inventory. We have already seen increasing levels of prolonged frequency of load-shedding Stages 5 and 6. At Stage 6 and above, mining operations would cease, which may extend over a period of several days. Figures 4 and 5 illustrate the annual progression of increases in intensity of load-shedding and duration in hours and days that occurred between 2015 and December 2022.
It is clear from these graphics that there has been an exponential deterioration of Eskom’s power generation to the extent that load- shedding Stages 3 and 4 have increased in duration and most worryingly, Stages 5 and 6 have had to be introduced to neutralise power generation and the grid.
Note that the duration of load-shedding in 2021 was 48 days, in 2022 this has climbed to 141 days and is expected to climb further in December. More importantly, the quantum of electrical energy which had to be shed also increased exponentially (Figure 5). In 2021, 2,521 GWh were shed, this quantum is estimated to climb to ~7,499 GWh in 2022.
Eskom has warned the duration of load-shedding at higher duration and frequencies will likely be the norm over the next five years. As indicated above, this will most certainly affect platinum (PGM) mine supply.
There are many reasons for load-shedding, these are unplanned outages due to underfunding, mismanagement, poor skills resulting in poor maintenance, contractor malfeasance, sabotage and crime syndicates. Race-based policies like affirmative action have destroyed institutional knowledge and skills at Eskom. The CEO of Eskom André de Ruyter said at a recent gathering that “coal corruption is endemic in
our supply chains”. “One recently discovered crime involved the theft of fuel oil worth around R100m a month. It is of interest to note that sabotage and crime have become so bad that the president is deploying members of the South African National Defence Force to some of the coal-fired power stations. The list of risks is endless. In combination the Energy Availability Factor (EAF) of Eskom’s coal fleet has declined to levels of uncertainty.
It should be noted that load-shedding does not only cause downtime losses and increased inventories but also has a significant impact on mine operations and equipment and maintenance costs. Repeated thermal damage to electric furnaces and converters cripples smelting operations. Furthermore, refining operations are highly sensitive to load-shedding.
This summary and the discussion illustrate the perilous position that South Africa and Eskom is currently in with respect to load-shedding. The country is heading for a catastrophic disaster if the decline in the EAF is not reversed with urgency. Over the years this objective has never been achieved.

Steep decline in power generation from coal-fired plants is set in concrete
Eskom has 15 coal-fired power stations, 4 gas/liquid fuel turbine stations and 1 nuclear power
station. Many of Eskom’s coal-fired plants are old and reaching their end of life.
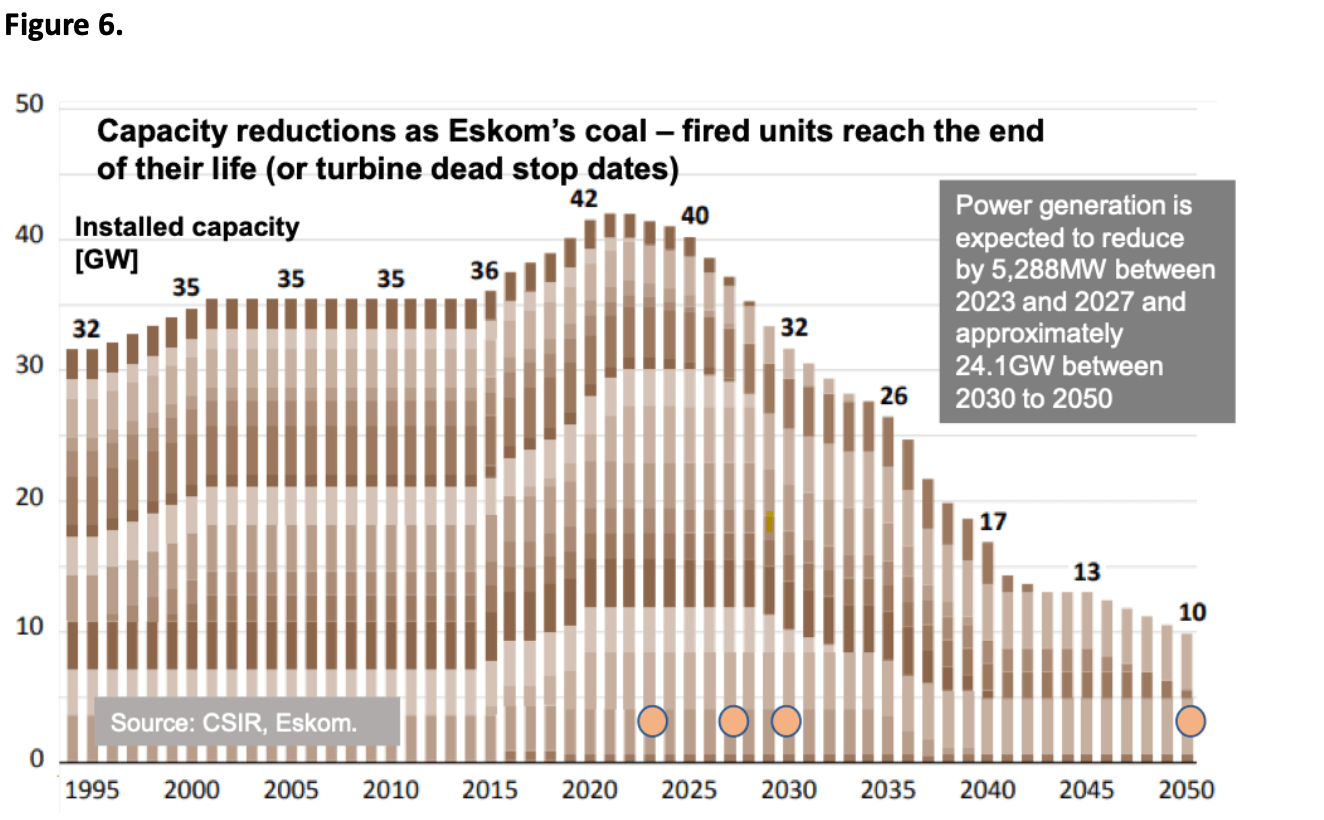
Figure 6 illustrates the end of life of Eskom’s coal-fired fleet. Power generation is expected to reduce by 5,288MW between 2023 and 2027 and by approximately 24.1GW between 2030 and 2050. It is important to note that power generation declines steeply from 2022 through to 2050, which amounts to a coal-fired energy gap of around 30GW.
Government plans getting bogged down thus far
The government and Eskom have set
out several plans designed to neutralise the electricity supply gap caused by the decommissioning of the coal-fired power stations by reducing the existing dependence on fossil fuels to a mix of renewable energy sources. The latest formal plan the “Integrated Resource Plan of 2019 (IRP2019)” has been met with several barriers since adoption, including serious procurement problems resulting in significant delays. Notwithstanding, the EAF of the coal fleet continued to decline and load-shedding increased. It was clear ‘’slippage’’ across all the planned objectives, none of which are likely to be achieved, and clearly the plan was not fit for purpose.
President Cyril Ramaphosa addressed the nation on the energy crisis (25 July 2022) noting “that during the past three weeks, severe load-shedding has disrupted all our lives and caused immense damage to our economy. The daily power cuts we have been experiencing have inconvenienced millions of households and have presented huge challenges for businesses. After more
than a decade without a reliable electricity supply, South Africans are justifiably frustrated and angry. They are fed up. We have therefore developed a set of actions to respond to the crisis. The crisis that we are facing requires that we should take bold, courageous and decisive action to close the electricity gap”.
In this regard, the president announced several steps to be taken “urgently” to ensure that these measures are implemented in a coordinated manner and established a National Energy Crisis Committee. Three months later, the government’s own report into the progress it is making in implementing the current five-year Medium- Term Strategic Framework from 2019 to 2024 showed signs of getting bogged down. The initial huff and puff is losing its puff.
The report concludes that the government should commit to “solid timeframes” for the review of the Integrated Resource Plan of 2019. Mineral Resources and Energy Minister Gwede Mantashe has confirmed that the IRP2019 – which is widely considered to include outdated demand, coal fleet energy availability factor (EAF), decarbonisation and technology cost assumptions – would be reviewed. However, no firm timeframe has yet been set for the finalisation of the update nor for the initiation of public consultations on the plan which makes specific technology allocations and outlines by when those technologies should be introduced. No specifics were provided on what the new procurement framework would involve, but the call for an update comes amid serious procurement delays that have afflicted both the fifth renewables bid window and the so-called risk-mitigation procurement round. (Engineering Weekly).
It is important to note that the government and Eskom have an abominable failure rate of completing projects on time; therefore, there is a high probability that any new build of electricity capacity will be late, further exacerbating the energy crisis. The impact of diminishing power lies squarely with a “cauldron” of political ideology, political interference, inadequacy, state capture and the inadequacy of capital expenditure. Basically, the government has done nothing to secure sustainability over the past 14 years.
The steep decline in power generation caused by the scheduled shutdown and unscheduled shutdowns of ageing coal-fired plants after 2022 through to 2050 illustrates just how precarious South Africa’s energy crisis is if the dependence on fossil fuels is not urgently addressed by replacement with a mix of renewable energy sources. Furthermore, increased intensity of coal-fired power generation maintenance to reduce unscheduled breakdowns is a priority.
Power generation system adequacy outlook between 2023 and 2027
As indicated, almost all the facts in this review come straight from Eskom’s reports and presentations and “The Medium-term System Adequacy Outlook (MTSAO) for the period 2023 to 2027, 30 October 2022”. This report is a generation assessment that measures the electric power system’s ability to meet demand over the next five calendar years within acceptable levels of reliability as defined by the adequacy metrics.
One of the most effective ways of measuring the power generation of a coal-fired power station is to compare the nominal rated capacity to its actual power generation output i.e., the percentage of the
maximum energy a plant can supply to the grid when not on a planned or unplanned outage. This metric is called the:
Energy Availability Factor (EAF). The EAF is the biggest lever to system adequacy.
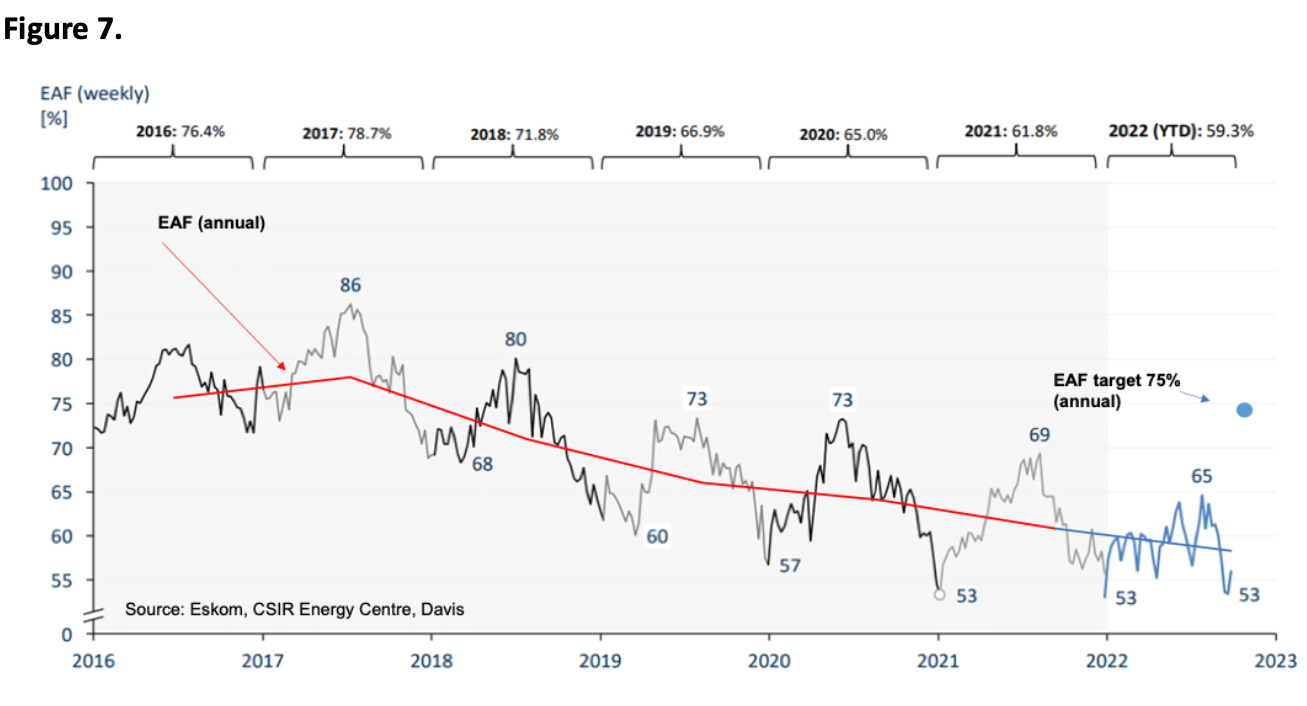
The EAF from the coal-fired fleet has declined from around ~80% in 2017 to 57.5% year-to-date October 2022 (Figure 7). The system adequacy report indicates a “more likely” scenario where we will see an average EAF of ~58% over the next five years. The report indicated that it expects a downward trend in plant performance to continue in the medium term, fuelled by increasing unplanned full and partial load loss. Note Eskom recently reported a weekly low of around ~53%.
This situation has contributed to a continuous decline in power supply, which has an impact on increasing load-shedding. The underlying cause of the deterioration in the fleet’s performance has been discussed in this conversation, it is, however, aggravated by equipment age and reduced system flexibility which are also factors contributing to the decline in power supply.
Figure 8 combines the two cause-and-effect levers that control load-shedding.
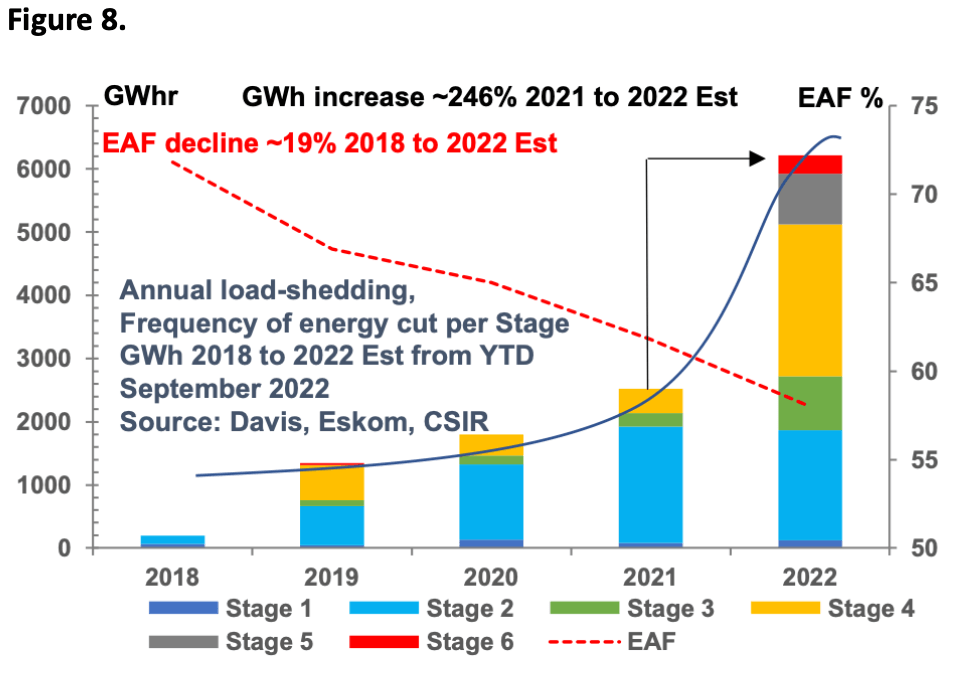
The Energy Availability Factor (EAF) of Eskom’s coal fleet which measures the efficiency of the fleet, depicted by the declining red dotted line. The decline in the EAF of around ~19% between 2018 and 2022F represents a substantial loss in power generation of Eskom’s coal fleet despite significant and costly maintenance efforts to improve the EAF to a target of 75% and above. This decline is the major cause of load-shedding and is represented by the bar chart overlay in GWh,
Annual load-shedding, frequency of energy cut per stage in GWh between 2018 and 2022F (estimate from year-to-date September
2022) is illustrated in Figure 8. This graphic illustrates an exponential and catastrophic increase in load-shedding of around ~246% between 2021 and 2022F. It is important to note that as the load- shedding accelerates, the intensity also increases; for example, between 2021 and 2022 Stage 4 load-shedding increases by around ~630%. Furthermore, two higher additional intensity load-shedding levels Stages 5 and 6 are required to neutralise the system.
At the higher Stages 4, 5 and 6 and high hourly frequencies, mine operations become severely impacted and are shut down. As indicated, this situation will worsen between 2023 and 2027. It should be noted that there were only 48 days of load-shedding in 2021, whereas in 2022F, I estimate that the frequency may well reach around 160 days and above. This figure will likely rise to between 200 and 300 days, at least, in 2023.
Eskom’s EAF was assumed to be 75.5% in the initial IRP2019, 2010- 2030 plan. The CSIR comments that the “historical fleet EAF decline seems irreversible… IRP2018 EAF did not materialise, and the risk of IRP2019 EAF not materialising is high”. This situation is likely to be heightened as five of Eskom’s coal-fired power stations are expected to be decommissioned by 2025.
The new Eskom board has set a 75% EAF target, which energy commentators have described as both unachievable and open to manipulation. Eskom executives have dubbed the target as “daunting” and have outlined plans for an EAF recovery to about 60% over the coming year.
In conclusion, the MTSAO study shows the following:
• The low EAF scenario is severely inadequate irrespective of the demand forecast scenarios.
- The high EAF scenarios are just about adequate, but only in the low-demand scenario, which does not support a higher economic growth rate.
- The high EAF and the moderate-high demand scenario is likewise inadequate.
It is clear from this summary and the discussion thus far that South Africa and Eskom are heading for a catastrophic disaster if the decline in the EAF is not reversed with urgency. Over the years, this objective has never been achieved.
Emergency power generation system has run out of fuel!
As indicated, South Africa has been subjected to record power outages this year, mainly due to breakdowns at Eskom’s old coal-fired plants.
In this regard, emergency power generated from Eskom’s open cycle, diesel-fuelled gas turbines (OCGT) are brought online, mainly during
peak demand periods to mitigate blackouts that are curbing economic growth. These turbines have a capacity of about 2,000MW.
At a recent state of the system briefing (November), Eskom’s COO Jan Oberholzer said that “since 1 April, Eskom has spent R12bn on diesel against an initial budget of R6.1bn. This was later revised to R11.1bn, which is nearly double the amount budgeted for this year (2022). Eskom has simply run out of money for fuel. Eskom indicates that it will only likely begin purchasing diesel again in the new financial year, starting on 1 April 2023, which means its woes will only continue to be exacerbated.
Reports in the new media indicate that “South Africa’s cash-strapped power utility Eskom has asked the National Treasury for R19.5bn to buy diesel to fuel auxiliary power plants – a request that’s unlikely to be heeded,’’ said Finance Minister Enoch Godongwana.
This means that at least 3,760 MW will be unavailable to Eskom, with significant budgets for diesel only likely to be made available in the new financial year, starting on 1 April next year.
Without operational OCGTs for at least four to five months, the risk of a system collapse is heightened, as Eskom cannot respond to emergencies. Furthermore, the duration and frequency of load-shedding is also heightened.
Energy expert Professor Anton Eberhard has warned that Eskom’s decision not to refuel its diesel OCGTs increases the risk of a total system failure.
Professor Eberhard, who is the director of Power Futures Lab at the University of Cape Town’s Graduate School of Business, also indicated that Eskom’s decision not to refuel its diesel OCGTs removes 2,067MW
from rapid response resources available to the system operator. “At a time of intermittent and declining coal plant output, it increases the risk of more load-shedding and system failure,” he said.
He added that “the cost of unserved energy for South Africa’s economy is much higher than the cost of running the Ankerlig (1,327MW) and Gourikwa (740MW) OCGT diesel plants. It is mad economics for Eskom to stop fuelling these due to regulatory constraints. The ministers are asleep again”.
Several South African platinum mines (Anglo American Platinum
(Amplats), Impala Platinum (Implats) Sibanye-Stillwater and Royal Bafokeng Platinum) have blamed their production underperformance, in part, on Eskom-related power cuts.
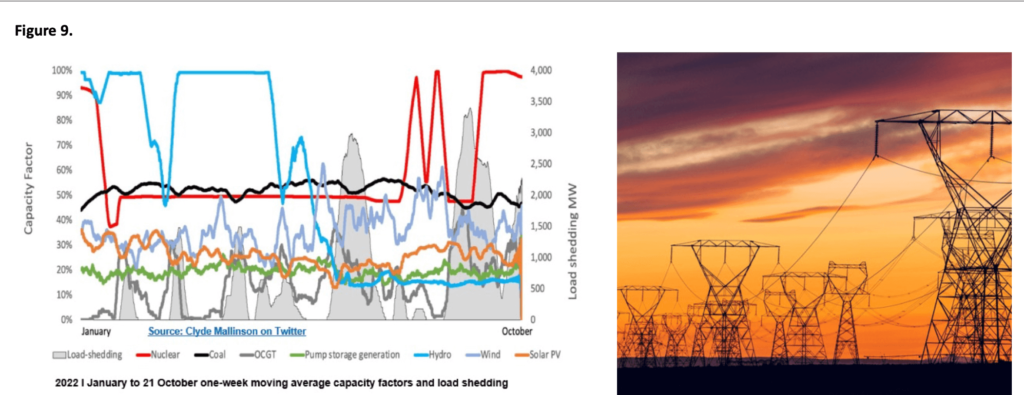
Figure 9 illustrates just how important OCGTs (dark grey line) are when load-shedding is implemented. The use of OCGTs supplements the power capacity during load-shedding (light grey fill). It becomes obvious that increasing levels of frequency increases the risk of load-shedding. As indicated, at Stage 6 and above operations would cease, which may extend over several days without the support of OCGTs.
Transmission expansions are critical to create access for new energy sources
Eskom has numerous sub-stations and transformers, with approximately 33,000km of transmission lines and has a national footprint in South Africa. Eskom indicates that the overall transmission network performance has deteriorated and requires capital for replacement in many areas. Eskom has a 10-year transmission refurbishment plan in place based on asset condition assessments, asset criticality and network risks. The new (TDP) 2022 will require new transition infrastructure over 14,218km between 2023 and 2032.
Studies such as Eskom’s Transmission Generation Connection Capacity Assessment 2024 (GCCA 2024) report notes that issues of the grid are a challenge to address in the medium term. The latest report notes that the limiting factor for connecting new generation is that the areas with the best solar or wind resources lack connection infrastructure. This is primarily the Greater Cape area comprising the Western Cape, Northern Cape and Eastern Cape networks that require “substantial upstream network strengthening to facilitate new generation capacity”. It concludes that:
The IRP 2019 capacity in its current form cannot be connected in those areas in the medium term. Therefore, transmission development projects need to be expedited to unlock potential generation initiatives.
Eskom has estimated the cost of implementing the TDP 2022 at around R72bn. This however assumes that Capex, servitudes, resource capacity and capability across the EPCM value chain barriers are resolved. Eskom has also indicated that ~ 53GW of new generation capacity will now be required by 2032 instead of ~30GW envisaged new generation capacity to be connected to the system by 2030.
Eskom has outlined major barriers in implementing the TDP 2022 including the time taken to acquire servitudes, constrained resource capacity in the country across the engineering, procurement and construction value chain to execute the plan and Capex requirements, especially in the latter five years of the plan.
In my view, it is clear from this summary of the new TDP 2022 that it is daunting and over-stretched and unlikely to be achieved on time, notwithstanding the capital requirements. Failure to deliver new capacity will lead to increased risk to the security of power supply and will prolong load-shedding significantly.
Eskom is bankrupt
Eskom is ‘technically bankrupt’ as its debt hits R396bn. The government plans to embark on an Eskom debt relief programme that will see it take over a portion of the utility’s debt.
The Finance Minister Enoch Godongwana outlined this plan, while tabling the 2022 Medium Term Budget Policy Statement (MTBPS) before
the National Assembly at the Cape Town City Hall. The minister said while the selection of the relevant debt instruments and the method of effecting the relief is still to be determined, the quantum is expected to be between one-third and two-thirds of Eskom’s current debt. The key question is however, where is the money going to come from?
Additional existential risks
I have previously referred in this dissussion to “additional existential risks”. For the South African platinum mines, one of many additional existential risks associated with the catastrophic energy crisis is the relationship between a decline in power supply and the subsequent acceleration of load-shedding.
As South Africa’s energy crisis accelerates, the impact on economic, social, political and climate change fall outs, will likely rise exponentially.
Senior researcher at the CSIR, Monique le Roux, using latest load- shedding data, said “that using the number of hours of unserved energy translates into R560bn lost to the economy in 2022 because of load-shedding. The bad news is that the government and Eskom do not have a coherent plan to end load-shedding in the short term. We have a dire outlook for the coming years. The government is increasingly going to struggle to get new generation capacity online.’’ Although it is challenging to predict the future, she said another 10 years of load- shedding is a possible scenario.
Finance Minister Enoch Godongwana noted in his presentation of the Medium-term Budget Policy Statement (MTBPS) to Parliament that escalating power cuts are having a “disastrous effect” on the South African economy, which has resulted in the National Treasury revising
its growth forecast for 2022 downwards from 2.1% to 1.9%.
Experts have worked out that Stage 4 load-shedding costs the South African economy nearly R1bn per day. Professor Mark Swilling at the Centre for Sustainability Transitions at Stellenbosch University said “In general, and ever-more-serious load shedding in particular, will plunge South Africa into an even deeper crisis, with disastrous economic consequences that will ultimately translate into mass protests that will make the July 2021 insurrection look like a picnic.There is no doubt that conditions are now so serious that it is appropriate to support the call for some sort of equivalent to a declaration of a national disaster for the energy crisis”.
Russia Nornickel
As far as Russian PGM primary mine supply goes, I am of the view that challenges in logistics, deliveries of equipment, spares, consumables and sanctions due to the Russian invasion of Ukraine will take their toll in the medium to long term. In fact, supply chain disruption is already happening. Nornickel reported (2 August 2022) that its sales of nickel, palladium and platinum fell in the first half of 2022 due to disrupted supply chains, and it is facing problems with logistics and supplies of imported equipment.
Nornickel has announced that it cannot guarantee 2023 production targets. Furthermore, I am of the view that Nornickel’s expansion/ refurbishment pipeline programme between 2024 and 2031, of which there are many, will be severely hampered by supply chain constraints and the lack of spare parts. Under these circumstances, it is reasonable to expect a downturn in platinum (PGM) supply from Russia and I would expect a decline in production of around ~5% to 10% in 2023.
It is important to note that Bloomberg News (December 20, 2022) reported unoffically, that Norilsk Nickel is considering cutting nickel output by about 10% next year.
I have listed the key strategic projects below (Nornickel annual report 2021) which are likely to encounter project slippage.
Key Strategic Projects
South Cluster
Location: Norilsk Division, Norilsk industrial District, Krasnoyarsk Region. Project description: in 2017, the South Cluster was spun off as a separate legal entity, Medvezhy Ruchey, a wholly owned subsidiary of the Norilsk Division. The South Cluster includes the Norilsk-1 deposit with disseminated ore reserves of over 140mt, Zapolyarny Mine (open- pit and underground mining), Norilsk Concentrator and two tailings storage facilities: No. 1 and Lebyazhye.
Ore output 9mt PGMs 750 to 850koz, Ni over 13kt, Cu over 20kt, full capacity in 2027.
Concentrator Capacity Upgrades
Location: Talnakh Concentrator, Norilsk Division, Norilsk industrial District, Krasnoyarsk Region.
Project overview: upgrade of Talnakh Concentrator (TOF) includes three stages: TOF-stage 3 (under construction; scheduled for completion in 2023; ramp-up to design capacity by 2024); plans to increase capacity to 18 Mtpa (with a 4% to 7% increase in recovery); build the second stage of the tailings storage facility; and increase the capacity of ore products storage to 190 million m3.
NOF Project
Location: Norilsk Concentrator, Norilsk Division, Norilsk Industrial District, Krasnoyarsk Region.
Project overview: construction of a new concentrator to process disseminated ores with a throughput capacity of up to 18mtpa of ore to replace the existing Norilsk Concentrator. The new concentrator will meet all industrial safety requirements while ensuring uninterrupted
operations. The construction is planned to be carried out in two stages and to be completed in 2026–2027: Stage 1: startup of the first section with a capacity of 9mtpa of ore. Stage 2: startup of the second section for the co-processing of disseminated ores from Talnakh and ores from the South Cluster and Maslovskoye deposit, with a total capacity of 9mtpa of ore.
Nadezhda Metallurgical Plant
Location: Norilsk Division, Norilsk industrial District, Krasnoyarsk Region. The project includes the construction of furnace gas recovery facilities, a sulphuric acid neutralisation line and associated infrastructure, including a gypsum storage facility. The project provides for the recovery of gases from smelting operations, covering the smelting expansion (the third smelting complex project). Impact includes a reduction of total SO2 emissions from the Norilsk Division facilities by 45% in 2023 from a 2015 baseline.
Smelting Capacity Upgrades
Location: Nadezhda Metallurgical Plant, Norilsk Division, Norilsk Industrial District, Krasnoyarsk Region Project overview: upgrade of smelting facilities at Nadezhda Metallurgical Plant to boost output and have spare capacity. Stage 3 (under construction, scheduled for completion by 2025) includes the construction of a third furnace with a capacity of 960ktpa to be integrated into the Sulphur Project 2.0. The Sulphur Project 2.0 includes gas capture, sulphur dioxide recovery and sulphuric acid production for subsequent neutralisation with limestone and construction of a third furnace with a capacity of 960ktpa to be integrated into the Sulphur Project 2.0.
Auctus Metal Portfolios Pte Ltd
Company Registration: 201828518M
23 Amoy Street, Singapore 069858
About Dr David Davis PhD. MSc. MBL. CEng. CChem. FIMMM. FSAIMM. FRIC.
David has been associated with the South African mining industry and mining investment industry for the past 45 years (mainly PGM, gold and
uranium). At present, David is working as an independent precious metal consultant. David’s PhD involved: “Studies in the catalytic reduction and
decomposition of nitric oxide 1976”.
Important Notice
General Disclosures, Disclaimers and Warnings
This Report (“the report”) in respect of the global platinum (PGM) Industry is directed at and is being issued on a strictly private and confidential basis to, and only to, Professional Clients and Eligible Counterparties (“Relevant Persons”) as defined under the Investment Research Regulatory Rules and is not directed at Retail Clients. This report must not be acted on or relied on by persons who are not Relevant Persons. Any investment or investment activity to which this Report relates is available only to Relevant Persons and will be engaged in only with Relevant Persons. The Report does not constitute or form part of any invitation or offer for sale or subscription or any solicitation for any offer to buy or subscribe for any securities in any Company discussed nor shall it or any part of it form the basis of or be relied upon in connection with any contract or commitment whatsoever. The opinions, estimates (and where included) projections, forecasts and expectations in this report are entirely those of Dr David Davis as at the time of the publication of this report, and are given as part of his normal research activity, and should not be relied upon as having been authorised or approved by any other person, and are subject to change without notice. There can be no assurance that future results or events will be consistent with such opinions, estimates (where included) projections, forecasts and expectations. No reliance may be placed for any purpose whatsoever on the information or opinions contained in this Report or on its completeness and no liability whatsoever is accepted for any loss howsoever arising from any use of this Report or its contents or otherwise in connection therewith. Accordingly, neither Dr David Davis nor any person connected to him, nor any of his respective Consultants make any representations or warranty in respect of the contents of the Report. Prospective investors are encouraged to obtain separate and independent verification of information and opinions contained in the Report as part of their own due diligence. The value of securities and the income from them may fluctuate. It should be remembered that past performance is not necessarily a guide to future performance. Dr David Davis has produced this report independently of the companies that may be named in this report except for verification of factual elements. Any opinions, forecasts, projections, or estimates or other forward-looking information or any expectations in this Report constitute the independent judgement or view of Dr David Davis who has produced this report (independent of any company discussed or mentioned in the Report or any member of its group). The Report is being supplied to you for your own information and may not be reproduced, further distributed to any other person or published, in whole or in part, for any purpose whatsoever, including (but not limited to) the press and the media. The distribution of the Report in certain jurisdictions may be restricted by law and therefore any person into whose possession it comes should inform themselves about and observe any such restriction. The Report has been prepared with all reasonable care and is not knowingly misleading in whole or in part. The information herein is obtained from sources that Dr David Davis considers to be reliable but its accuracy and completeness cannot be guaranteed.
Dr David Davis Certification
Dr David Davis attests that the views expressed in this report accurately reflect his personal views about the global Platinum Industry. Dr David Davis does not hold any interest or trading positions in any of the Companies mentioned in the report.

