Latest Performances
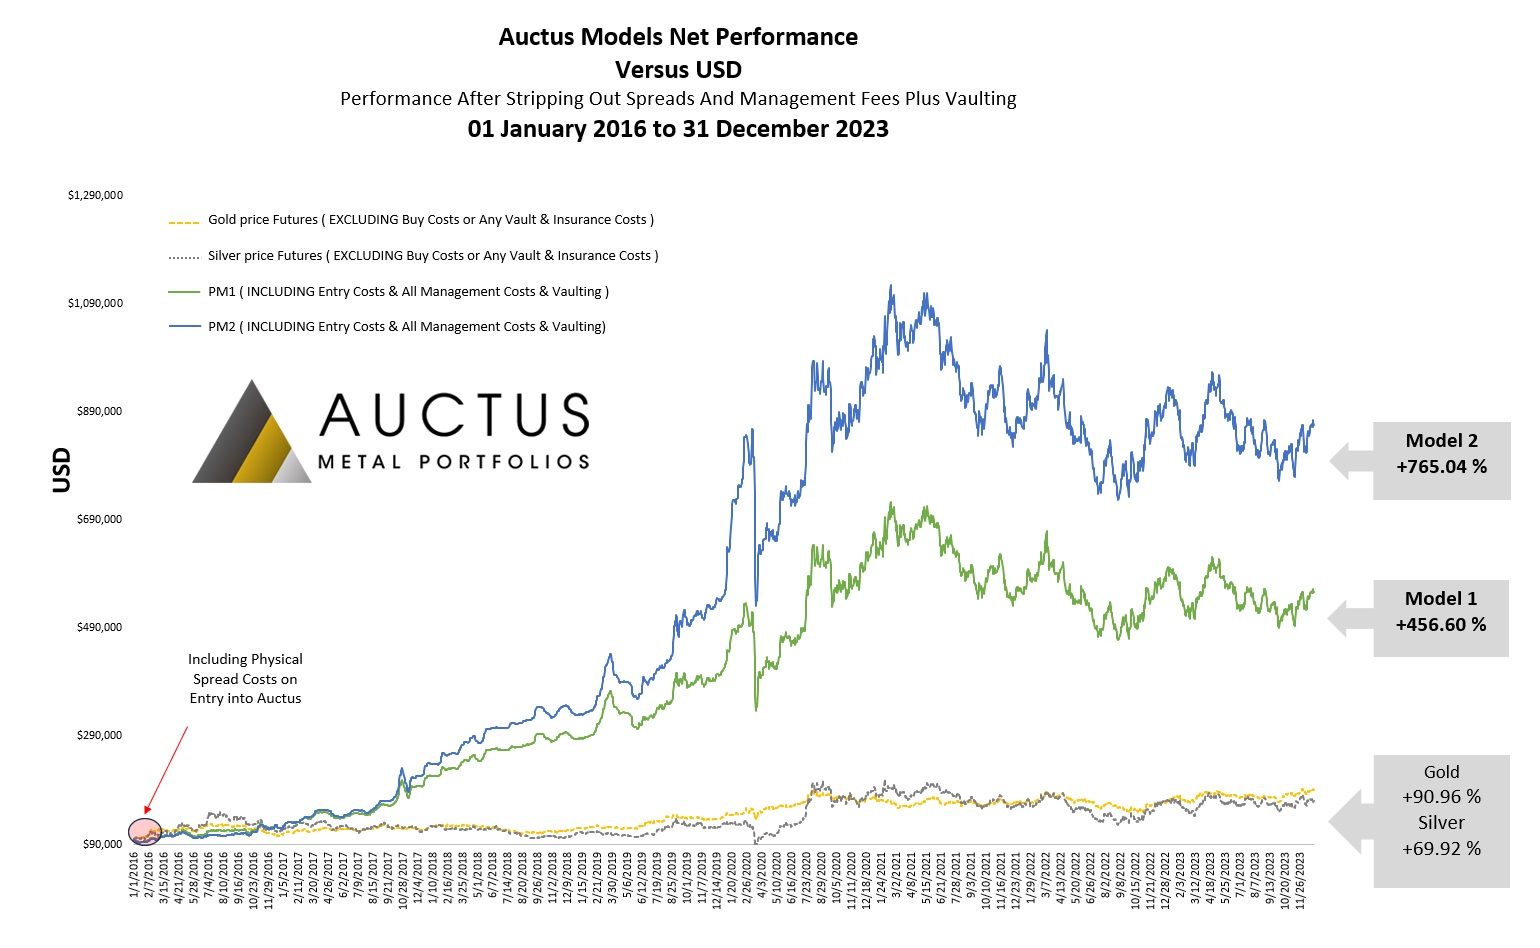
Auctus Metal Portfolios’ (Provectus Model 2) Net Return on Investment to 31 December 2023 After Spreads, Management Fees and Vaulting Costs are Deducted
Calendar Year Performance | Net Return to Clients
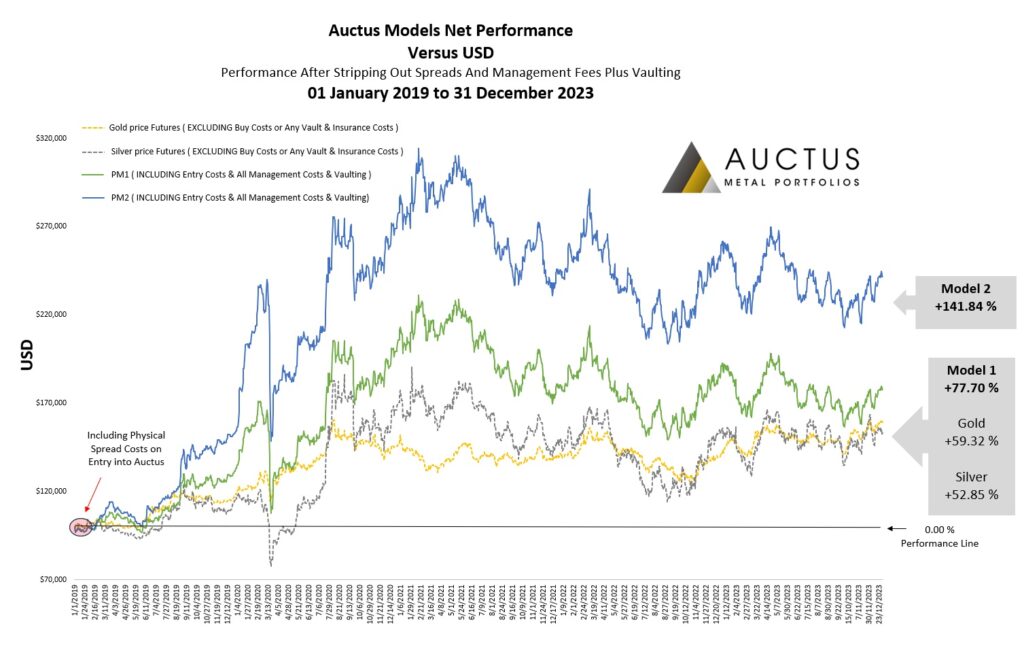
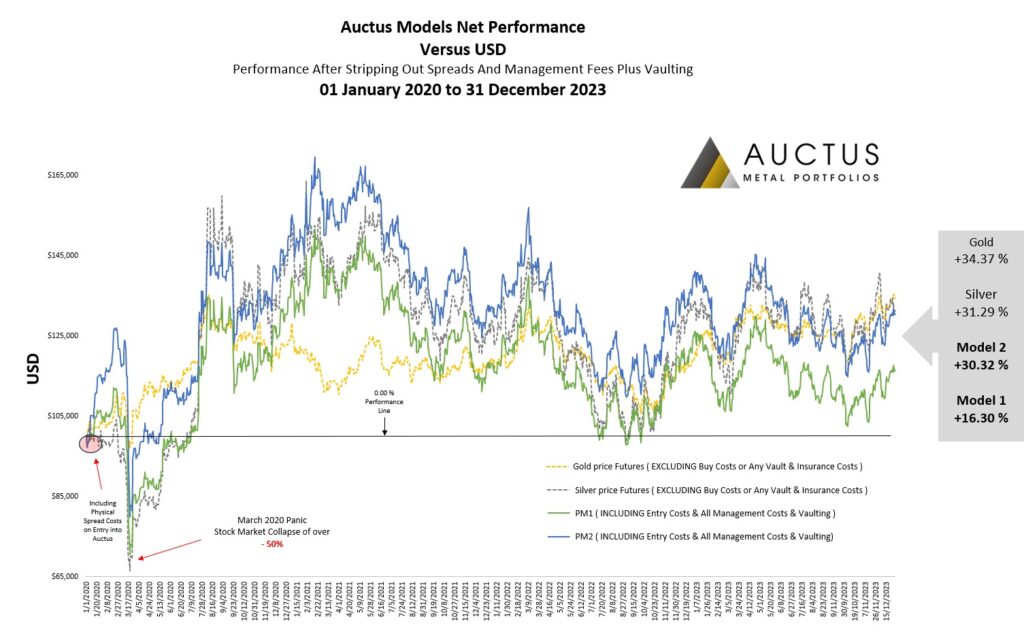
- 8-Years: +765.04% since 1 Jan, 20167-Years: +519.53% since 1 Jan, 20176-Years: +189.63% since 1 Jan, 20185-Years: +141.84% since 1 Jan, 20194-Years: +30.32% since 1 Jan, 20203-Years: -14.89% since 1 Jan, 2021
- 2-Years: -2.40% since 1 Jan, 2022
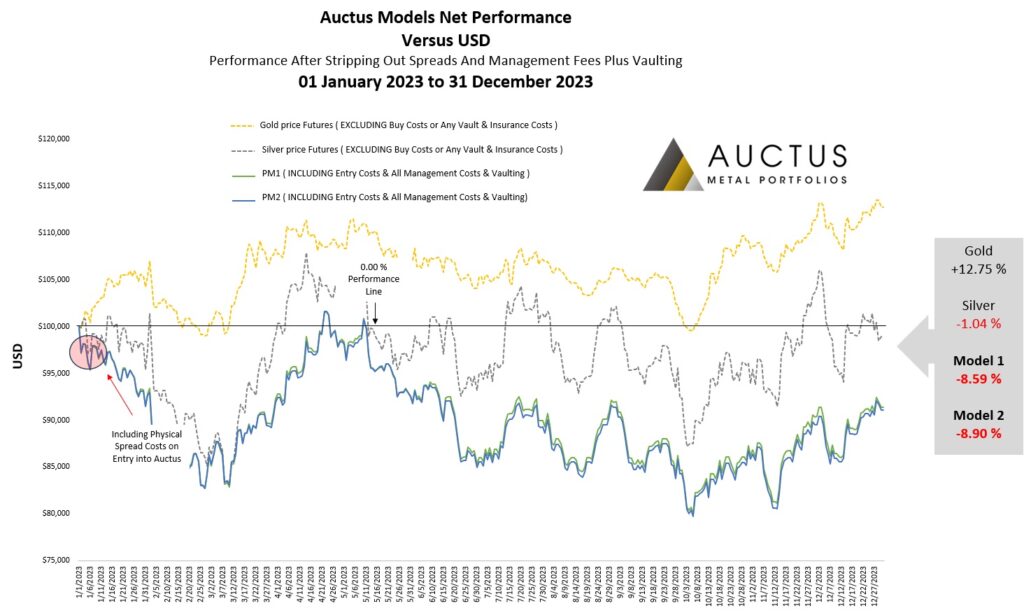
- 1-Year: -8.90% since 1 Jan, 2023
Please note that the net returns above have been calculated after all transaction costs have been stripped out, this includes (bid / offer spreads), vaulting fees and also Auctus Metal Portfolios’ management fees. These returns take into account funds that have been fully invested since the start of each year and do not take into account client performances when entering at differing time frames within this overall performance range.
When considering Auctus Metal Portfolios performance against actual Gold and Silver spot prices (see the charts below) – kindly note that these “spot futures” prices do not take into account the costs of running such physical positions (i.e. physical precious metal premiums on entry, vaulting fees, insurance and audit costs etc).


