The consequences of a significant and continuing decline in power generation will extend to all four corners of the country and beyond, with dire consequences. The impact on the South African PGM platinum mine supply will be disastrous for global platinum mine supply; moreover, this situation will likely create a barrier to global decarbonisation. Experts have indicated that the country could be in this position for up to 10 years. The accruing deficit in the platinum market balance will put significant upward pressure on the price of platinum.
It should be noted that projected loss in South African platinum mine supply does not include the potential and significant decline in platinum supply during the winter months. Furthermore, in the long-term, PGM platinum grades are expected to decline and hence an overall decline in supply from South African platinum mines is expected.
From Nornickel’s Q1 2023 report, I expect a downturn in platinum supply from Russia of around ~4% to ~5% in 2023 y-on-y, which will exacerbate the decline in the global supply of platinum.
Setting the scene
This review concentrates on the decline of Eskom’s ageing fleet of coal-fired power stations and the impact on PGM platinum mine supply from South Africa and globally. It is obvious that platinum mining operations and mine supply are being severely and progressively affected at higher intensity and frequency (hours and days) of load-shedding. It is important to note that South Africa, Russia and Zimbabwe represent around 73%, 10% and 8% of global platinum supply, respectively. In this regard, it is immediately evident that 90% to 92% of the world’s platinum supply comes from just three countries. This geographical and political concentration of supply can be described as ‘highly uncertain’.
I am of the view that it is absolutely imperative for investors to gain a clear understanding of the factors that are leading to the demise of Eskom and the consequent decline of South African platinum mine supply.
My initial discussion focuses on the status of Eskom’s rapidly declining power generation, which is resulting in severe power blackouts or load-shedding. There are currently 8 stages of load-shedding. Stage 1 represents an energy gap of 1,000MW which must be shed, Stage 8 represents an energy gap of 8,000MW which must be shed. At Stage 8, half the power load is shed. Given the deterioration of Eskom’s grid and energy availability, it has now become prudent to plan even further ahead. These plans have yet to be published but could include stage extension to 11 or even 16! I assume these stages will include anywhere above 24-hour power outages at a time, which would have catastrophic implications for South Africa and of course on PGM platinum mine supply.
The shutdown of platinum mines for extended periods will have an enormous impact on global mine supply resulting in a platinum market balance deficit, which in turn, will put significant upward pressure on the price of platinum.
The link between the stages of load-shedding and PGM platinum mine closure.
This review discovers two important relationships: Firstly, a significant and important link:
The relationship between the Coal Fleet Capacity Factor (CF) and Eskom load-shedding Stages 1 to 11eq.
This relationship was published in March this year by Clyde Mallinson, an energy expert and perspicacious analyst and director at Virtual Energy and Power. Mallinson formulated a forecast relationship between the CF and Eskom load-shedding Stages 1 to 11eq for each month of 2023, in what I would call a ’heat map’. The map shows by way of colour coding from green to red, the low and high load-shedding stages respectively. Mallinson used historical data to predict the maximum and average levels of load-shedding for the rest of the year, which were well evaluated to within an error range of +-half a stage of load-shedding, or 500MW. Note, the CF is a ratio of actual power output relative to the theoretical maximum that could have been output over a period. The Eskom Utilisation Factor (The EUF) measures ‘how hard’ the units are being run.
The second important relationship uses Mallinson’s monthly heat map to facilitate a link between the stage which initiates the beginning of PGM platinum mine closures and at which stage mining operations will cease.
A third connection was investigated between the quantum of platinum losses at high intensity and duration (days) at a load-shedding mix of Stages 4, 5 and 6, which is when mining operation will cease.
The first and second important relationships
To facilitate a link between the stages of load-shedding, it is important to know the stage which initiates the beginning of PGM platinum mine closures and at which stage mining operations will cease. This relationship was achieved
by combining the protocol of stage closures adopted by Impala Platinum (Implats interim results FY2023) with Mallinson’s relationship between the CF and Eskom load-shedding Stages 1 to 11eq. These two important relationships are illustrated graphically in Figure 1.
Figure 1. Relationship between the Coal Fleet Capacity Factor and Eskom load-shedding Stages 1 to 11eq, and the potential impact of winter months on load-shedding with Stages between 4 and 11, (worst case), which will progressively impact South African PGM (platinum) supply.
As indicated in Figure 1, load-shedding is strongly correlated to demand, as well as the capacity of coal plants. The picture looks very bleak, especially in mid-winter. Mallinson’s graphic shows the worst-case scenario at a CF of 40%. In this regard, South Africa would be subjected to Stage 8 load-shedding in April, Stage 9 in May and Stage 11 in June. Mallinson indicated that Eskom must lift the coal fleet’s CF to at least 50% to prevent high levels of load- shedding over the winter months. Note, the actual CF for January, February, March and April (20th) was 38%, 39%, 42% and 40% respectively. In my view, it is unlikely that Eskom will achieve the 50% CF level on the current run rate.
The second important relationship that facilitates a link between the CF and the stage of load-shedding when mining operations
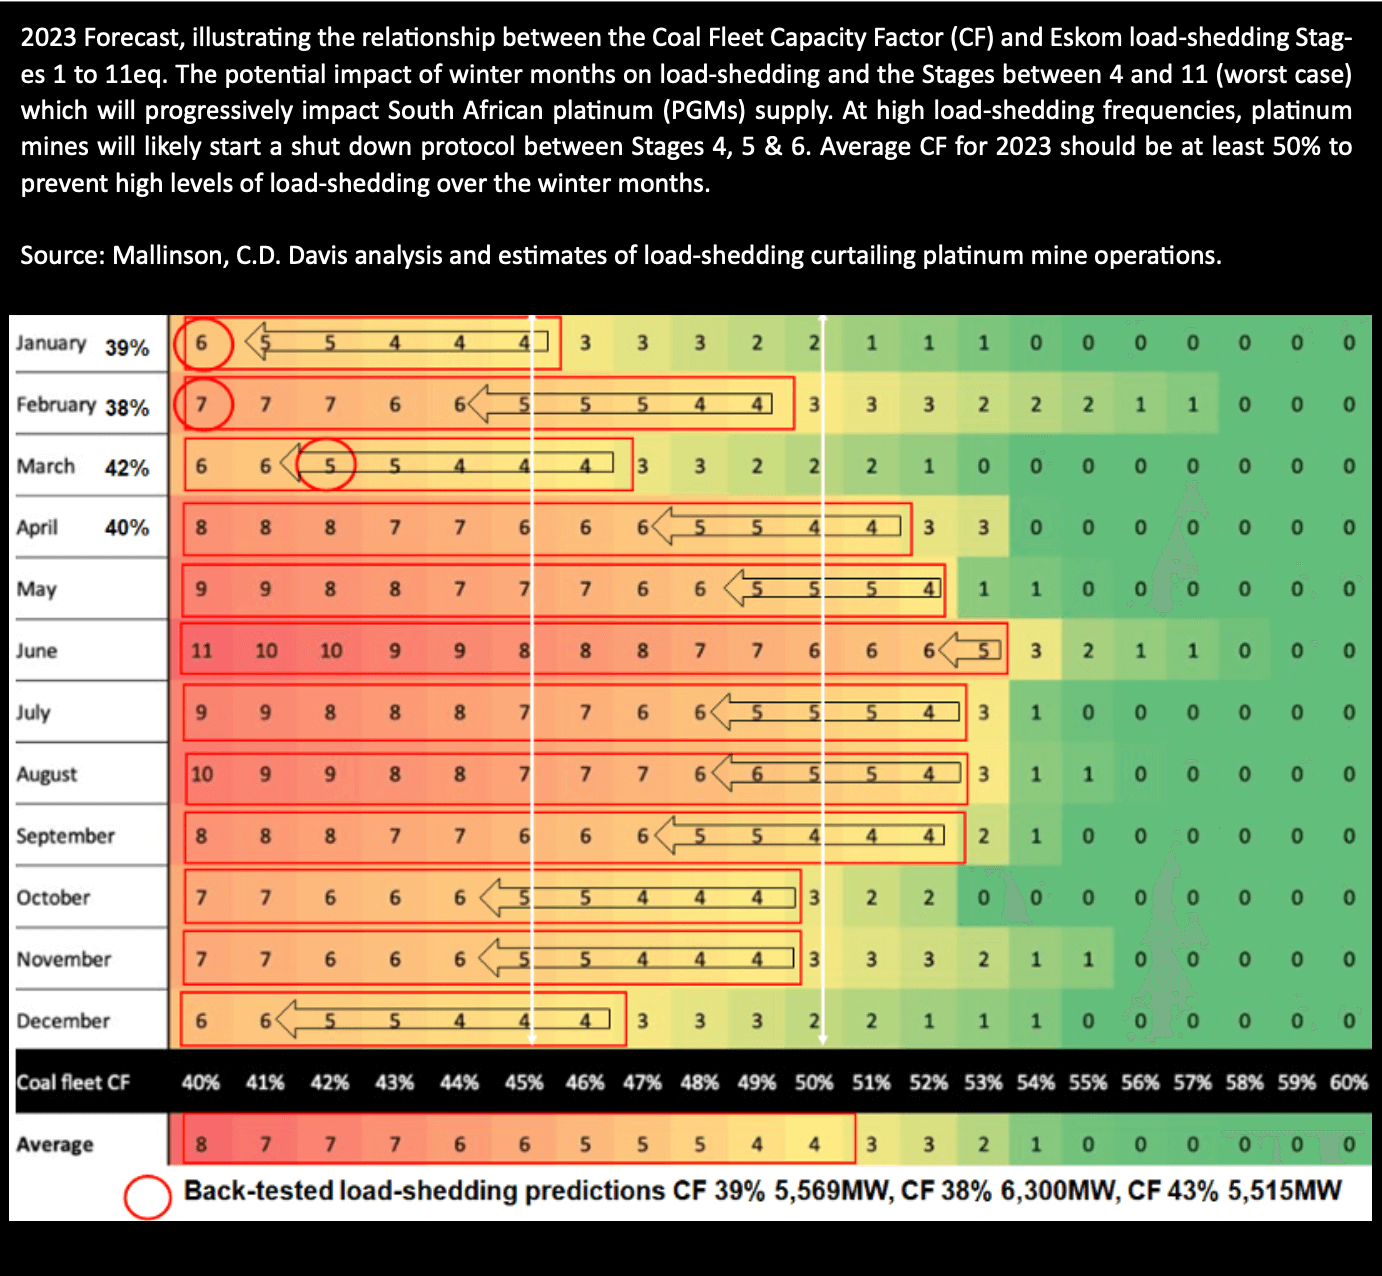
will cease is illustrated graphically in Figure 1, by the black arrows. Note the importance of achieving a CF of 50% and above (marked by the white lines). At this level, the yearly average load-shedding comes in at Stage 4; however, the forecast still indicates a high risk of partial shutdown and full shutdown of the platinum mines, particularly the deep mines, from May through to September. At a CF of 45%, load-shedding worsens considerably, resulting in Stage 6 on average.
Load-shedding averages can conceal the large variances in the quantum loss of PGMs / platinum and inventory build within each platinum mining company and their individual mines. Figure 1 therefore represents a macro view. This view represents a snapshot forecast of how catastrophic the decline in power supply is to South African platinum mine supply.
The new Electricity Minister, Kgosientsho Ramokgopa, has recently warned that Eskom faces a shortfall of 8,000MW to 10,000MW this winter, which equates to Stages 8 and 10 of power cuts. The minister said that “We are in for a difficult winter on the back of the persistent Stage 6 power cuts of late. As temperatures drop, power demand will increase and misery will kick-in for those who cannot afford power-generating alternatives”.
Experts are predicting Stage 8 load-shedding as a common feature of South African power supply.
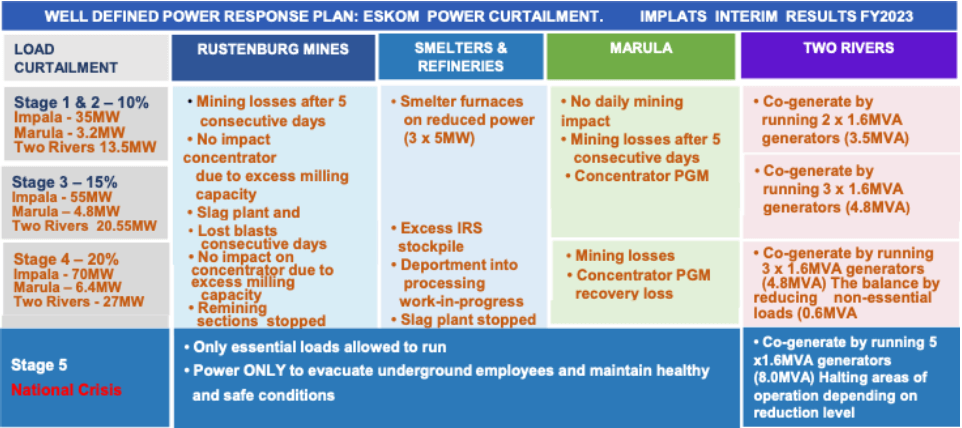
Impala Platinum (Implats) recently reported its load-shedding operational protocol, illustrated by Figure 2. At Stage 4, the mine is required to offset 20% of its power. At this stage, operations start to slowly bite into mine supply. Rustenburg mines, smelters and refineries, and Marula mining operations come to a halt at Stage 5. Implats labels Stage 5 a National Crisis. Only essential loads are allowed to run, power is used only to evacuate underground employees and maintain safety conditions. Implats reports mining losses at load curtailment starting at 10% to 15% after five consecutive days. This protocol will come as a surprise to the industry as Stage 6 was always thought to be the critical stage when operations came to a halt. Furthermore, alternative options for power containment begin to kick in at Stage 4.
Figure 2. Implats power curtailment protocol
The relationship between a decline in power supply and its quantum impact on PGM platinum mine production cannot be measured directly because of the complexities surrounding this calculation. Furthermore, the effect of load-shedding cannot be exactly extrapolated to other PGM mines, as each mine has structural and complex differences that need to be considered; for example, compare open cast, shallow and deep mines. Much depends on the load-shedding protocol adopted to take these differences into account.
Moreover, it is also important to note that hard comments from South African
platinum mining companies are beginning to include the consequences of the impact of higher intensity and frequency of load-shedding on platinum mine supply. It is, however, still uncertain as none of the mining companies have experienced such high intensity and frequency of load-shedding over a sustained 1 year period.
Under these circumstances, I expect a significant increase in mine platinum (PGM) inventories as well as a decline in supply over the period from 2023 to 2027. The build-up in mine inventory will likely keep occurring; however, at some point during this period, smelters, converters and refining operations will likely be overwhelmed by the backlog of inventory, as these operations are temperature sensitive to extremes in power input. Furthermore, the unit cost of production will also likely increase exponentially, resulting in a squeeze on margins.
I also expect a ’structural change‘ in the operations of the South African platinum mining industry to maintain equilibrium with power supply. This equilibrium will likely result in a decline in platinum mine supply and, as a result, put further pressure on the continuous decline in the platinum market balance deficit, thereby forcing platinum to new price highs.
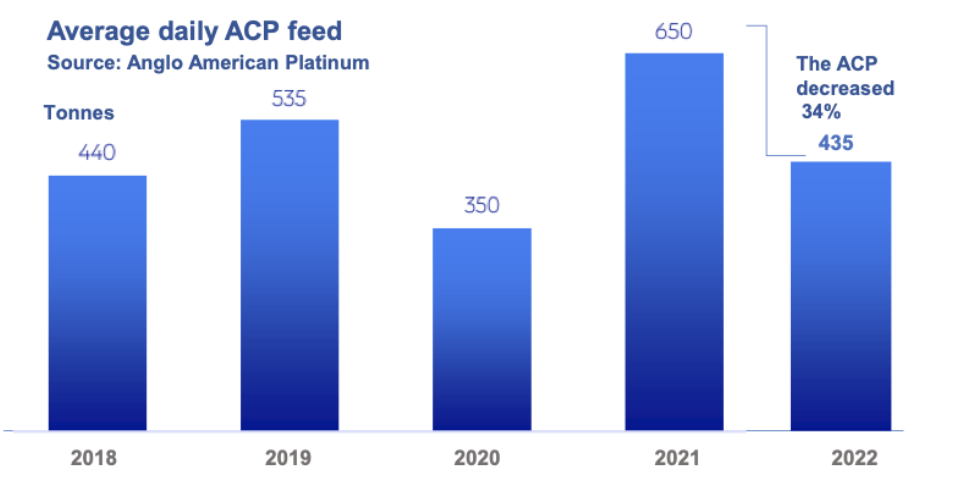
For example, Amplats has indicated that during the last quarter of 2022 the furnace matte processed at the Rustenburg ACP was constrained, decreasing by some 34% (Figure 3). Amplats indicated that the decrease in tonnage smelted reflects the challenges experienced from the uptick in Eskom load curtailment, as well as the delay in returning the Polokwane furnace to operation. Amplats also attributed the ACP capacity constraint to the high nickel content of Mogalakwena material, which will cause a temporary matte build-up at the end of the year and which will only be fully released in 2024. Downstream from the RBMR.
Figure 3. Amplats average daily ACP feed
Converter matte receipts were 32% lower than 2021. Total refined PGM production (including toll refining) decreased by 25% (according to Amplats).
In my view, the high intensity and frequency of load-shedding is here to stay. The smelting and converting operations will likely cause a bottleneck and interruptions to the feed of the refining operations. Hence, my reference to a ‘structural change’ in the operations of the South African platinum mining industry to maintain equilibrium with power supply.
This review thus far has discovered a link between the stages of load-shedding and PGM platinum mine closure using the relationship between the Coal Fleet Capacity Factor and Eskom load-shedding Stages 1 to 11eq.
The link equation forecasts the potential effect of the winter months on load- shedding, particularly between Stages 4 and 11 (worst case), will result in a severe impact on South African platinum (PGM) mine supply to the point of closure of most operations, including the big producers. Therefore, inventory will not be processed, which will result in the closure of the downstream refinery.
The evidence presented is indisputable. These results will have a significant impact on mining operations: unit costs will increase significantly, capital expenditure and margins will decline unless offset by an increase in the basket price of PGMs in USD. Moreover, supply chain problems will be a barrier to efficient operations as the rest of South Africa will also be overwhelmed by this catastrophic decline in power supply.
The third connection
A third connection was investigated between the possible quantum of platinum losses at high intensity and duration (days) at a load-shedding mix of Stages 4, 5 and 6, which is when mining operations will cease.
As indicated, the relationship between a decline in power supply and its quantum of impact on PGM mine production cannot be measured ‘directly’ for now because of the complexities surrounding this calculation. The frequency and level of load-shedding stages can, however, be measured. Much depends on the load-shedding ‘protocol’ adopted to take these differences into account. Furthermore, the increase in intensity and frequency of load-shedding, only began to bite into platinum mine supply during the last quarter of 2022.
Hard results are beginning to emerge regarding the impact on platinum mine supply. This leaves us, for now, with a series of ‘estimated probabilities‘ and ‘best estimates‘ taken from previous load-shedding experiences (frequency and duration) about the likely impact on PGM mine supply. Note also, that the duration of load-shedding will likely rise from 157 days (in 2022), to between 175 and 310 days at least between 2023 and 2027. This will be mainly as a result of government bickering, insufficient maintenance budgets, mismanagement, poor maintenance, contractor malfeasance, sabotage and crime syndicates. This situation will be exacerbated as ageing coal-fired power station are progressively taken offline.
In my previous review on this subject, I estimated that South African platinum mine supply will fall by ~500koz to ~1,000koz representing a decline of at
least ~12% to ~20%, and globally by around ~9%, as power shortages in South Africa bite into production from 2023 to 2027. My predictions have recently been confirmed by Sibanye-Stillwater, which has indicated an expected loss of PGM mine supply of ~15% due to the high frequency of load-shedding.
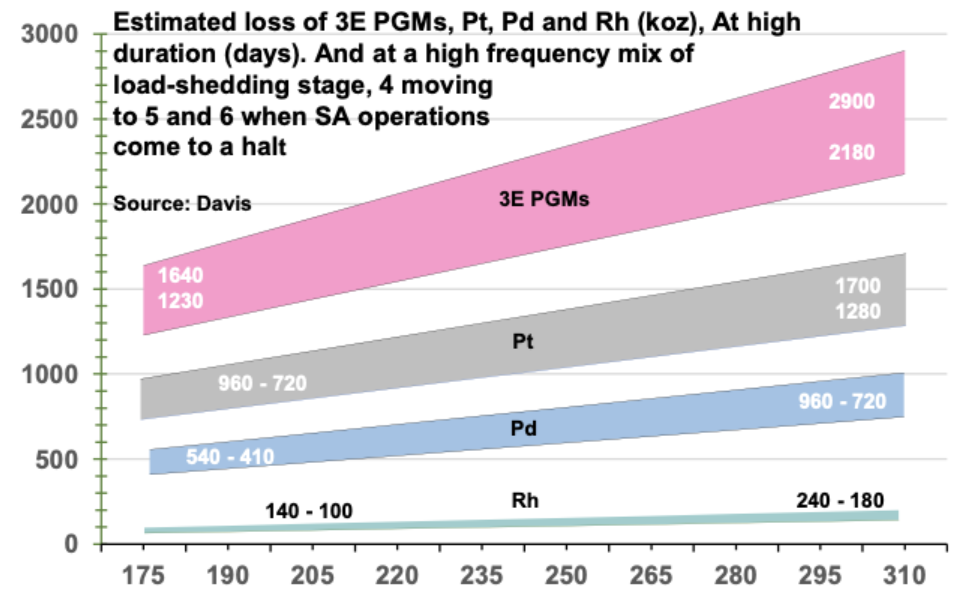
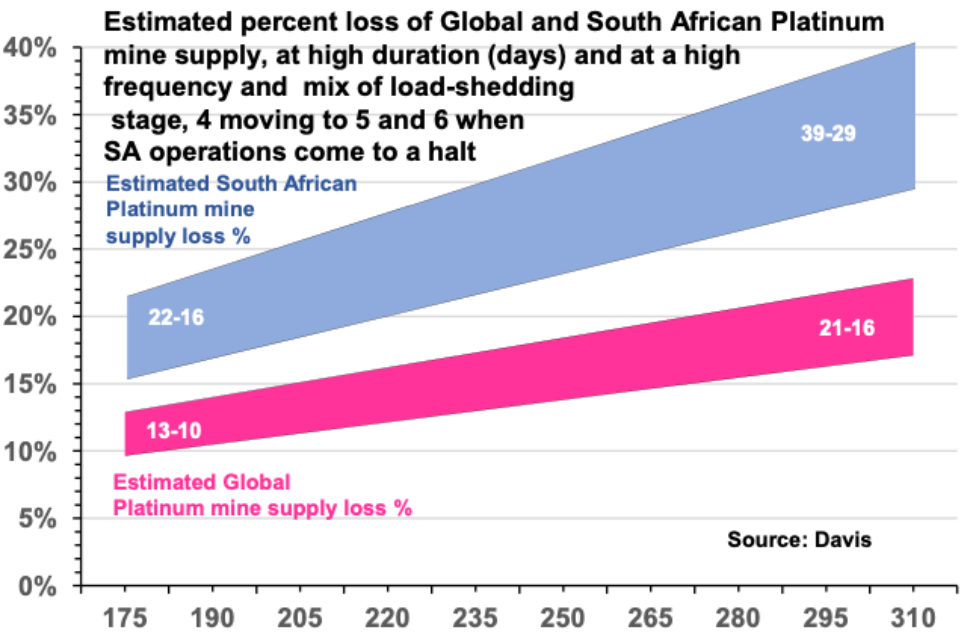
Figures 4 and 5 illustrate my updated ‘estimated’ annual impact of load- shedding on global and South African platinum mine supply, which will likely occur between 2023 and 2027. The figures are a best estimate of platinum, palladium and rhodium losses at high duration (days) and at a load-shedding mix of Stages 4, 5 and 6. At Stage 6, mining operations will effectively cease.
Figure 4. Estimated loss of 3E PGMs, Pt, Pd and Rh (koz) at between 175 and 310 days of load-shedding duration.
The projected estimated loss in South African platinum mine supply represents around ~840koz rising to ~1,500koz for platinum, ~475koz rising to ~840koz for palladium and ~120koz rising to ~210koz for rhodium. Between 175 and 310 days of high intensity load-shedding. (Mid-point figures).
Figure 5. Estimated percentage loss of global and South African platinum mine supply
The projected estimated percentage loss in South African platinum mine supply represents around ~19% rising to ~34% for South Africa, and around ~11.5% rising to ~18.5% for global mine supply. Between 175 and 310 days of high intensity load-shedding. (Mid-point figures).
The impact on the quantum of decline in mine supply of PGM platinum due to high frequencies of load-shedding is significant and will be far reaching, touching every aspect of PGM demand in particular the supply and demand for platinum.
The accruing deficit in the platinum market balance will put significant upward pressure on the price of platinum.
Eskom’s ageing fleet of coal-fired power stations and their impact on PGM platinum mine supply
Power generation has worsened
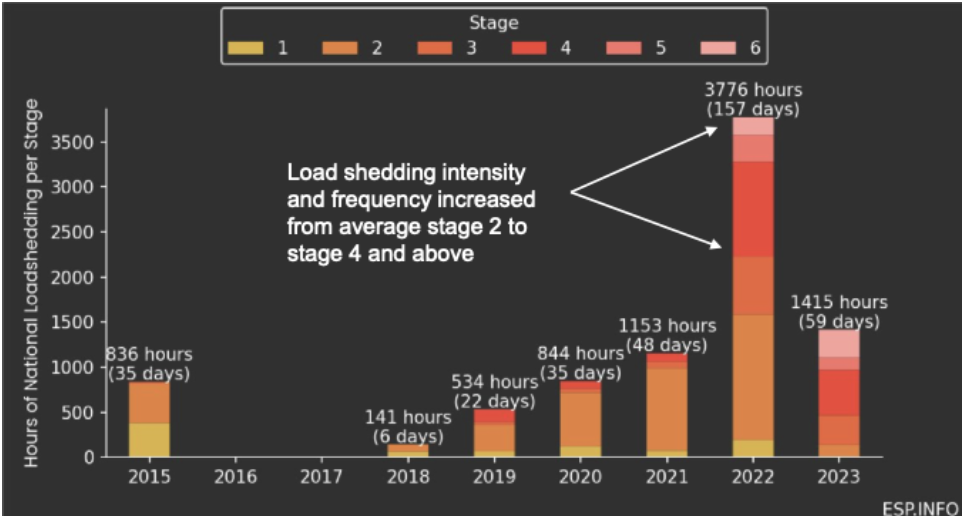
The state of power generation has worsened considerably since my last review published by Auctus Metal Portfolios in December 2022. The intensity and frequency of load-shedding has increased from Stage 2 to Stage 4, and to Stages 5 and 6 during the last quarter of 2022. Figure 6 illustrates this upward shift in load-shedding in 2022 as compared with 2021.
The shift in load-shedding is expected to continue throughout 2023. That is, from 157 days in 2022 and at higher intensities and frequencies. A catastrophic outlook.
Figure 6. Annual load-shedding, intensity, and duration (2015 to date)
Why will the intensity and frequency of load-shedding continue to increase?
Eskom’s power stations
Eskom has 14 coal-fired power stations, 4 gas/liquid fuel turbine stations and 1 nuclear power station. Eskom’s problems are further exacerbated by its ageing fleet of coal-fired power stations, some of which are reaching their end-of-life. Eskom closed the dilapidated coal-fired Komati plant last year and is due to close another 5 of its 14 remaining coal-fired plants by 2030.
Government failure
The government has an abominable failure rate of completing projects and/ or a plan on time; therefore, there is a high probability that any new build of electricity capacity will be late or likely not happen at all, thereby further exacerbating the energy crisis. The impact of diminishing power, lies squarely within a ’cauldron’ of political ideology, political interference, inadequacy, state capture and lack of capital expenditure. Basically, the government has done nothing over the past 16 years to secure sustainability.
Moreover, mismanagement, poor maintenance, contractor malfeasance, sabotage, crime syndicates and corruption are rife. According to the former Eskom CEO, Andre de Ruyter, these factors have not diminished and will continue to weaken the ability of Eskom’s coal-fired power stations to function efficiently. De Ruyter also said that Eskom is under siege by high-level criminality, from syndicates that steal coal, diesel and infrastructure to dodgy contracts and procurement irregularities. He said that criminality is closely tied to politics and feeds into significant initiatives, placing them at risk. De Ruyter was subjected to a series of escalating political attacks and threats on his life, and Mineral Resources and Energy Minister Gwede Mantashe for example, accused the former Eskom CEO of treason.
This lack of support and outright hostility towards him led to him resigning late last year. In the weeks leading up to his resignation, De Ruyter was
subjected to a series of escalating political attacks and threats. According to EE Business Intelligence, on 13 December, De Ruyter drank a cup of coffee laced with cyanide. The day before, he had submitted his resignation letter to Mpho Makwana, the Eskom chairman. Fortunately, he survived this assassination attempt.
Nothing has changed since and political squabbling has heightened as South Africans are now being subjected to Stage 6 load-shedding. Moreover, according to IOL, the ANC is using its parliamentary majority to block the investigation into corruption at Eskom. It appears that they are ready to cover up anything that implicates them or their leaders. There have been numerous warnings from experts that South Africa faces a winter of social unrest: Political analyst JP Landman and Nedbank’s chief economist Nicky Weimar said South Africans could expect another Marikana and July 2022 type riots in the future. Efficient Group chief economist Dawie

Decline in capacity as coal-fired units reach their dead-stop date
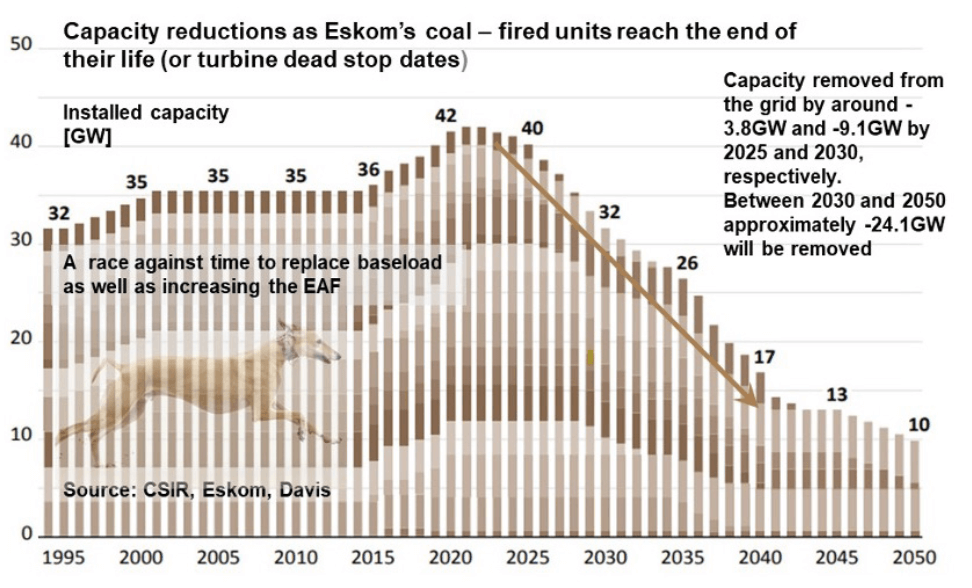
Figure 7. illustrates the end-of-life profile of Eskom’s coal-fired fleet. Power generation is expected to reduce by 5,288MW between 2023 and 2027 and by approximately 24.1GW between 2030 and 2050. It is important to note that power generation declines steeply from 2022 to 2050, which amounts to a
coal-fired energy gap of around 30GW. This situation will exacerbate the need for load-shedding for at least 10 years if the base load is not replaced by green energy production systems.
Figure 7. Power capacity reduction as coal-fired units reach the end of their life
Clearly, there is a race to shore up the existing coal-fired power stations by improving the energy availability factor (EAF) and building a new green energy base load. Alas, in my view, there will be no winners in this race, only ‘losers’.
The former Eskom CEO Andre de Ruyter had highlighted the need for massive new generation investment but was lambasted for his comments.
Alternative options will likely fail including upgrading of the transmission infrastructure
The Minister of Electricity Dr. Kgosientsho Ramokgopa recently presented
his plan, which is intended to hasten growth and reduce load-shedding “over the next six months”, to cabinet. All these options are, in my view, ’tenuous’ and ‘capital intensive’ and will take a ‘long time’ to implement. There is a snag, Ramokgopa does not have any ministerial powers, making his role and function within the cabinet unclear. The Public Enterprises Minister Pravin Gordhan and Minerals and Energy Minister Gwede Mantashe, has similar, but different responsibilities for energy. Gwede Mantashe is responsible for ending load-shedding, including the implementation of the Energy Action Plan. Gwede Mantashe has been reported to favour the use of coal.
Public Enterprises Minister Pravin Gordhan and Electricity Minister Ramokgopa appear to have different views on what to do with Eskom’s ageing coal-fired power plants. Gwede Mantashe is at odds with Pravin Gordhan and Cabinet colleagues on renewable energy. The political merry-go-round starts once again, which is destined for failure given the government’s abysmal track record for implementing and completing energy related plans.
One of the four main options detailed in Minister Ramokgopa’s plans include what would be a highly controversial and illegal plan to extend the life of certain coal plants beyond their dead-stop date. This plan would virtually require a rebuild and a huge amount of capital expenditure to obtain the necessary recertification. Public Enterprises Minister Pravin Gordhan indicated that full life-extension retrofits would take, at a minimum, two years to complete, while flue gas desulphurisation (FGD) retrofits would likely require up to seven years to complete, at a cost of around R400bn. The second option is to apply for pollution exemptions because most of the coal-fired power stations are unable to meet legislated minimum emissions standards.
Eskom has said previously that a decision by the Department of Forestry, Fisheries, and the Environment in November 2021 to rein in emissions from Eskom’s coal-fired power stations would require an immediate shutdown of 15.9GW of coal-fired generation capacity and about 30GW (about two-thirds of total capacity) by April 2025. This decision is now under review pending further public stakeholder meetings, which will be concluded early in 2025.
The third and fourth options involve five poorly performing coal-fired power stations, which have recorded an EAF below 50%; they are to receive extra attention: The fourth option is to run Eskom’s open-cycle gas turbines (OCGTs), which are needed to compensate for the loss of capacity due to breakdowns at Eskom’s coal-fired power stations. According to reports, the OCGTs when required, burn around nine million litres of diesel a day. The government will allocate R30bn for six months over the winter period to cover the OCGT diesel consumption. The big snag however, will be whether extra cargo ships required to supply this enormous amount of diesel be available? If so, it is unlikely they would arrive within six months.
Moreover, there will be limited power to offload the diesel due to load- shedding. Business Day recently reported that it is also not possible for Eskom to use more than R2.4bn of diesel (about 100 million litres at current wholesale prices) in a month, due to the logistical limitations of delivering the diesel to the OCGT stations. Only time will tell. This six-month plan, in my view, is not viable under these circumstances.
Furthermore, the $8.5bn (around R1.5trn) Just Energy Investment Plan (JET- IP) Transition Partnership with France, Germany, the UK, the US and the European Union could be at risk. This, given that the partnership is premised on supporting South Africa to retire its coal stations and replace them with green energy renewables, according to the schedule outlined in the Integrated Resource Plan 2019 (IRP), which outlines South Africa’s decarbonisation commitments.
Unfortunately, many, including some in government, consider the IRP 2019 plan not fit for purpose. The new IRP has yet to be submitted. Moreover, the financing for JET-IP has yet to be secured since the Transition Partnership has not been enacted.
There is another big snag. The latest Eskom report, System Adequacy Outlook October 2022 (MTSAO), notes that the limiting factor for connecting new generation is that the areas with the best solar or wind resources lack connection infrastructure.
This is primarily the Greater Cape area comprising the Western Cape, Northern Cape and Eastern Cape networks that require “substantial upstream network strengthening to facilitate new generation capacity”. Alas, these networks CANNOT BE CONNECTED in those areas to unlock potential generation initiatives. Between 2023 and 2027 the first phase of the transmission infrastructure build will require 2,900km of power lines, with additional transformers, etc. According to Eskom, this build assumes total capex of R72bn to 2032, and requires servitudes, resource capacity and capability across the EPCM value chain to be resolved. Monique le Roux, a senior researcher at the Council for Scientific and Industrial Research (CSIR), said South Africa is facing another decade of rolling blackouts. Her prediction is based on the premise that it would take 10 years to execute essential infrastructure projects to upgrade Eskom’s power grid.
I am of the view that the JET-IP could be delayed by several years given the government has an abominable failure rate of completing projects. Under these circumstances, the increase in intensity and frequency of load-shedding will likely be prolonged. In this regard, the JET-IP partners will not be amused.
Eskom fleet Energy Availability Factor (EAF), Eskom Utilisation Factor (EUF) and Capacity Factor (CF)
This conversation will be brief in order to give clarity to the meaning of these acronyms: the EAF, EUF and the CF. It is important to note that these factors represent the key influencing factors of ‘how well’ a power station is running and should not be viewed separately:
- Energy Availability Factor (EAF): The percentage of the maximum energy a plant can supply to the grid when not on a planned or unplanned outage. Basically, if a power station is well run and maintained, the EAF should be between 70% and 80%. If the EAF falls and/or trends downwards, the EAF signals plant deterioration, which can be caused by several factors; for example, lack of maintenance, poor maintenance, skipping maintenance
and abnormal wear and tear caused by pushing the plant too hard to supply as much electricity as possible to keep load-shedding at lower stages for shorter periods.
• Eskom Utilisation factor (EUF): EUF measures ‘how hard’ the units are being run. This metric, measured in percentage, is an indicator of stress on systems and components. High utilisation means plant systems are required to operate at their limits, leading to strain, increased wear and tear, decreasing reliability and the requirement for increased maintenance. Conversely, a higher EAF would reduce the EUF and give Eskom the opportunity to maintain the units appropriately and timeously. The lower the EAF, the higher the EUF must be to supply as much electricity as possible to keep the lights on. A high EUF puts the system under threat of collapse since the entire network is powered by a smaller number of generating units.
• Capacity factor (CF): Measures in percent ‘how hard’ the plant is running against its maximum possible output. CF is a ratio of actual power output relative to the theoretical maximum that could have been output over a period.
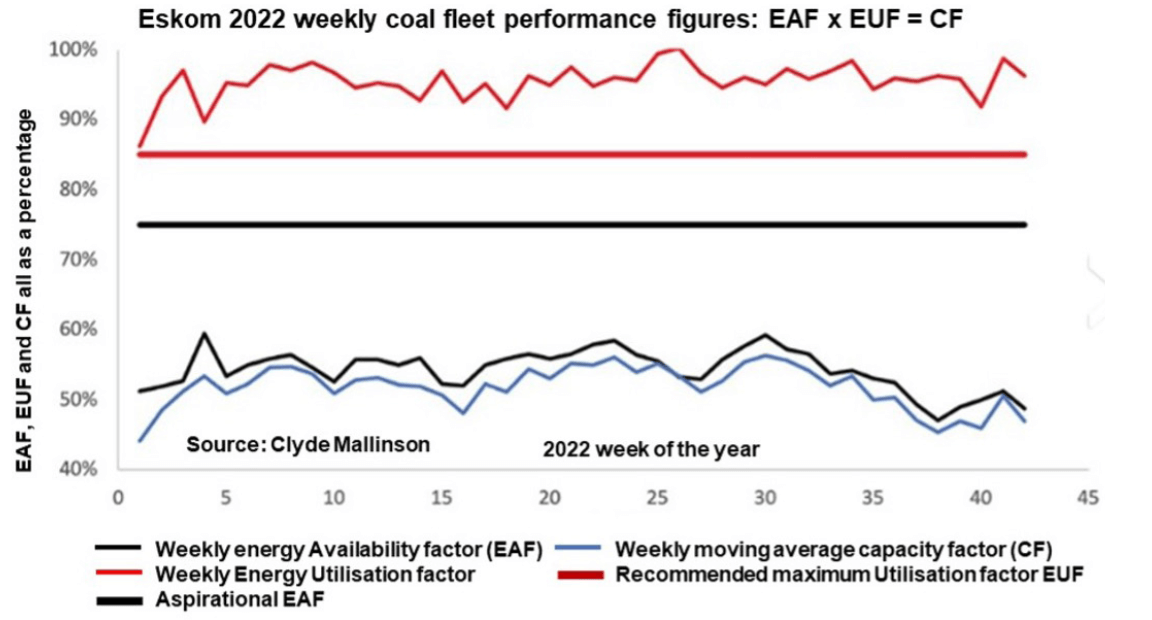
Figure 8. is a graphic illustration of the practical use of the EAF, EUF and CF, the definition and consequences of which have been described above for coal-fired plants.
Figure 8. Eskom 2022 weekly relationship between fleet energy factor (EAF), Eskom Utilisation Factor (EUF) and Capacity Factor (CF).
A cartoon relationship between the EAF and the EUR is illustrated below:

In general, the Eskom fleet’s quoted EAF can easily be manipulated according to experts. Similarly, the coal fleet’s EAF follows a similar trend and can also be manipulated. According to Mallinson, this measure can also be managed upwards through removing units from the system, which changes the denominator, but does not increase output.
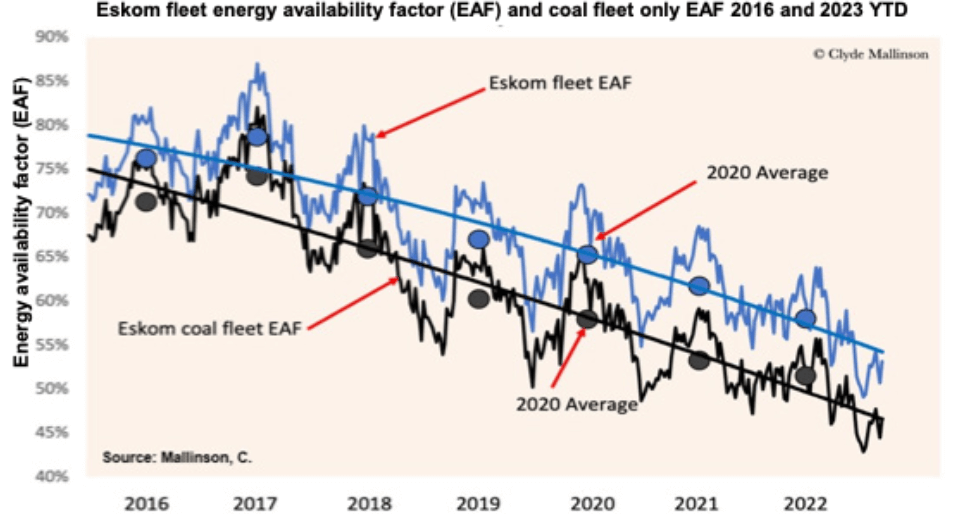
Eskom fleet EAF and coal fleet only EAF 2016 and 2023 year-to-date are illustrated by Figure 9. The Eskom fleet average has continued a long-term annual decline from around 72.8% in 2018 to 58.1% in 2022, which represents a drop in EAF of some 20% (CSIR).
This declining trend in the EAF is one of the main drivers of the increase in load-shedding. Efforts to reverse this trend in the decline have failed. Unfortunately, as mentioned, maintenance budgets have been throttled by insufficient investment from the government, mismanagement, poor maintenance, contractor malfeasance, sabotage and crime syndicates.
Figure 9. also illustrates the Eskom fleet and coal fleet energy availability factors (EAF) up to week 9, 2023. YTD the EAF for the entire fleet is 52%. The coal fleet’s EAF YTD is 45.64%, and the capacity factor is 45.2%. Mallinson explained that this means that all available coal units are being used at close to 100%, which is not good at all.
Figure 9. Relationship between fleet EAF and coal fleet only EAF 2016 to 2023 YTD
The new Eskom board has set a 75% EAF target, which energy commentators have described as both unachievable and open to manipulation. Eskom executives have dubbed the target ‘daunting’ and have outlined plans for an EAF recovery to about 60% over the coming year.
Experts have warned that it will be extremely difficult to reverse the downward trend of the EAF. Some of these comments were collated by the Daily Investor, 23 March 2023.
Professor Anton Eberhard from the University of Cape Town said it is very hard to turn the EAF around unless there is more spare generation capacity. “Bringing back four damaged units at Kusile, one at Medupi, and a Koeberg nuclear unit will help, but it won’t be enough,” he said. He added that former Eskom CEO Andre de Ruyter highlighted the need for massive new generation investment but was crucified for his comments.
Energy analyst Chris Yelland explained that the energy availability factor is on a declining trend, and has been for the past five years. The EAF is based on the average performance of 90 generators in Eskom’s electricity generation fleet. “You cannot maintain or fix them simultaneously,” he said.
What this means, mathematically, is that the EAF is a continuum. There cannot be discontinuity – also known as a step change – in the EAF trend. “To increase Eskom’s EAF, there must first be a slowdown. It then must bottom out, stabilise, and start to rise. This process will take several years,” he said. “It is mathematically impossible for this to happen in the 2023/2024 or 2024/2025 financial years,” Yelland said. “Talk of a 70% or 75% energy availability factor is misleading the public, and it is not achievable by Eskom.”
All these plans described above, involve massive capital expenditure except for the $8.5bn JET-IP. Where will the government acquire this capital? Eskom has a significant debt of R400bn. It is not an option to source capital in the open market, unless perhaps China steps in?
Koeberg’s life extension is the swing factor
The Koeberg Nuclear Power Station will reach the end of its design life in July 2024 (Unit 1). When both units are running, they contribute roughly 1,860MW, which represents some 5% of South Africa’s electricity. Koeberg is currently undergoing a life extension programme. If these refurbishments continue after 24 July 2024, Unit 1 and Unit 2 will have to shut down in November 2025. According to Eskom’s Medium-Term System Adequacy Outlook (MTSAO, October 2022), a delay of Koeberg’s life extension will severely constrain the system and exacerbate the grid inadequacy. This situation remains an elevated risk.
All is not lost?
According to the Minerals Council of South Africa SA mining sector consumes ~14% of Eskom’s electricity. If smelters and refineries are added, the total consumption for the mining sector moves up to ~30% of Eskom’s output. In the short to medium term, Eskom will remain a source of baseload supply for the mining industry, since solar and wind energy are intermittent.
The pipeline of planned renewable projects of the private sector is around 9GW of energy projects in solar, wind and gas, as well as battery storage. The private sector’s estimates are around 3GW of the 9GW by the end of 2024.
South Africa’s large platinum mining companies’ short-and-medium-term renewable energy plans are described below (data from AMIQ).
Sibanye-Stillwater has proposed a three-project plan to introduce 175MW of renewable energy across its platinum group metal (PGM) mining operations in South Africa, which will consist of an 80MW solar PV project at its Rustenburg Platinum Mines Complex, a 65MW solar PV project at its Karee Complex and a 30MW solar PV project at its Bushveld Complex. Accounting for approximately 39% of the group’s energy demand, Sibanye-Stillwater’s South African PGM operations are equivalent to approximately~ 310MW. At an estimated cost
of between $164.5 million and $184 million, Sibanye-Stillwater has indicated that the solar projects will be funded through third-party power purchase agreements. These projects are expected to be completed by H1 2025.
Impala Platinum has launched a tender for the commissioning of a 10MW solar PV project at its Marula Platinum mine in the Limpopo province of South Africa, with commercial operation scheduled for 2024. The winning bidder will design, finance and construct the solar project. The Marula Platinum Mine Solar PV Park will cost an estimated $11.95 million.
Anglo American Platinum is building a 100 MW solar PV plant at its Mogalakwena mine in the southern African country’s Limpopo province. The solar PV plant is expected to become operational by the end of 2023.
Northam Platinum has indicated that they will install modules of 10MW.
It is my view, as South African commercial private property and industries will go private in the long term, Eskom will likely become defunct. Moreover, municipalities will start losing revenues.
About Dr David Davis PhD. MSc. MBL. CEng. CChem. FIMMM. FSAIMM. FRIC.
David has been associated with the South African mining industry and mining investment industry for the past 45 years (mainly PGM, gold and uranium). At present, David is working as an independent precious metal consultant. David’s PhD involved: “Studies in the catalytic reduction and decomposition of nitric oxide 1976”.
Important Notice
General Disclosures, Disclaimers and Warnings
This Report (“the report”) in respect of the global platinum (PGM) Industry is directed at and is being issued on a strictly private and confidential basis to, and only to, Professional Clients and Eligible Counterparties (“Relevant Persons”) as defined under the Investment Research Regulatory Rules and is not directed at Retail Clients. This report must not be acted on or relied on by persons who are not Relevant Persons. Any investment or investment activity to which this Report relates is available only to Relevant Persons and will be engaged in only with Relevant Persons. The Report does not constitute or form part of any invitation or offer for sale or subscription or any solicitation for any offer to buy or subscribe for any securities in any Company discussed nor shall it or any part of it form the basis of or be relied upon in connection with any contract or commitment whatsoever. The opinions, estimates (and where included) projections, forecasts and expectations in this report are entirely those of Dr David Davis as at the time of the publication of this report, and are given as part of his normal research activity, and should not be relied upon as having been authorised or approved by any other person, and are subject to change without notice. There can be no assurance that future results or events will be consistent with such opinions, estimates (where included) projections, forecasts and expectations. No reliance may be placed for any purpose whatsoever on the information or opinions contained in this Report or on its completeness and no liability whatsoever is accepted for any loss howsoever arising from any use of this Report or its contents or otherwise in connection therewith. Accordingly, neither Dr David Davis nor any person connected to him, nor any of his respective Consultants make any representations or warranty in respect of the contents of the Report. Prospective investors are encouraged to obtain separate and independent verification of information and opinions contained in the Report as part of their own due diligence. The value of securities and the income from them may fluctuate. It should be remembered that past performance is not necessarily a guide to future performance. Dr David Davis has produced this report independently of the companies that may be named in this report except for verification of factual elements. Any opinions, forecasts, projections, or estimates or other forward-looking information or any expectations in this Report constitute the independent judgement or view of Dr David Davis who has produced this report (independent of any company discussed or mentioned in the Report or any member of its group). The Report is being supplied to you for your own information and may not be reproduced, further distributed to any other person or published, in whole or in part, for any purpose whatsoever, including (but not limited to) the press and the media. The distribution of the Report in certain jurisdictions may be restricted by law and therefore any person into whose possession it comes should inform themselves about and observe any such restriction. The Report has been prepared with all reasonable care and is not knowingly misleading in whole or in part. The information herein is obtained from sources that Dr David Davis considers to be reliable but its accuracy and completeness cannot be guaranteed.
Dr David Davis Certification
Dr David Davis attests that the views expressed in this report accurately reflect his personal views about the global Platinum Industry. Dr David Davis does not hold any interest or trading positions in any of the Companies mentioned in the report.


