Global Platinum Primary Mine Supply Plus Recycling and Demand Estimates

Platinum Supply – a Barrier to Global Decarbonisation in the Vehicle, Transport and Industry Sectors
This review focuses on the conundrum that the Platinum (PGMs), global vehicle (& other transport) and industry sectors face with regards to the mismatch that is developing between the future quantum of Platinum supply and demand, against the backdrop of the ongoing pursuit of decarbonization on a global scale. It is important to note that Platinum (PGMs) and hydrogen are critical elements required to open pathways to achieving global decarbonisation and net zero emission targets by 2050.
This review shows that the future quantum of global demand for Platinum (PGMs) significantly outweighs global supply from 2023 onwards, which will cause a market deficit. This continued and widening deficit will undoubtedly support the price of Platinum moving forwards, ceteris paribus.
The main use of Platinum (PGMs) is currently for emission controls, which are facilitated by catalytic converters in internal combustion engine (ICE) based passenger vehicles, buses and trucks. Vehicle manufacturers have turned to alternative drive train technologies such as battery electric vehicles (BEV) in their quest to achieve decarbonisation. Autocatalysts represent around ~43% of global Platinum (PGMs) demand today: The acceleration of next-generation clean energy technology has begun, with the introduction of zero-emission fuel cells (FC) and PEM water electrolysers. This technology uses Platinum and Iridium (Ir) catalysts for these applications, demand for which is set to increase substantially over time. Clearly, the phasing in of BEVs will result in a decrease in Platinum demand; however, the demand for Platinum will likely increase significantly in support of the production of FC and PEM electrolysers and other clean energy applications. It should be noted
that Iridium demand for PEM water electrolysis far exceeds current global production. Further, Iridium accounts for ~1% of PGM primary supply, so its production to meet demand through to 2050 would require several new mine start-ups, particularly from the primary suppliers of PGMs from South Africa, which may not be financially feasible for miners or refiners (DOE, 22 February).
In this review, I question the expectations of many in the industry about whether there will be any major underground start-ups. In fact, I expect a decline in global Platinum (PGM) supply, particularly from both South Africa and Russia.
Umicore PEM Fuel Cell Electric Vehicle
It should be noted that in this review, my forecasts are estimates; therefore, forecasting the quantum of Platinum demand comes with assumptions and limitations and should be viewed as such. It is difficult to project a view this far out (2030 – 2060); however, my estimates where possible, are supported by data obtained from research organisations including: IEA, ICCT, US DOE, IHS, Wood Mackenzie, World Platinum Investment Council, Metals Focus, SFA (Oxford), Heraeus, Johnson Matthey and company reports among others.
Furthermore, many notable organisations such as the IEA, Simon Flowers, Wood Mackenzie and the DOE among others, have indicated the need to develop multiple solutions to achieve net zero emissions. This review does not take these alternative pathways into account. As a matter of interest, Wood Mackenzie suggests that getting to net zero by 2050 will cost around US$60 trillion in technologies and innovation. Note also, PGMs are deemed essential to the US economy and national security. The US presently relies on 79% of net imports of Platinum.
Global Platinum demand to 2050
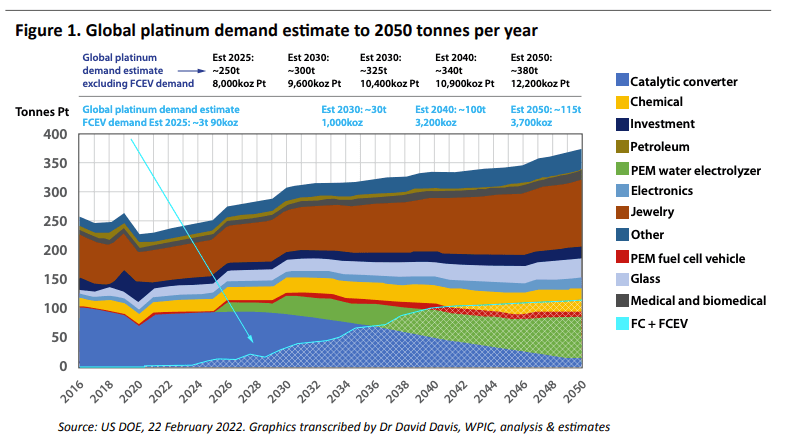
Figure 1 represents a global Platinum demand estimate to 2050, in tonnes/year, (The US Department of Energy’s (DOE) report of 22 February 2022). Figure 2 represents the WPIC (Metal Focus) forecast for Platinum demand by application for 2022.
Figure 1 integrates two independent forecasts: Global Platinum demand and FCEV Platinum demand. It seems that the DOE has assumed that PEM water electrolysers take priority over FC and FCEV vehicles, but not heavy-duty trucks. In this regard, I have superimposed the demand graphic with the growing demand for FC and FCEV for light vehicles (LV) and heavyduty (HD) trucks to 2040, as recently reported by the WPIC.
Figure 1 implies that the demand for ICE vehicle catalytic converters begins to decline gradually from around ~2026 to ~2028. The rate of decline increases from 2030 to 2050.
Similary, the demand for PEM water electrolysers, FC and FCEV offset the decline for ICE catalytic converters.
The total annual Platinum demand for the period, including FC and FEV, for 2025, 2030, 2040 and 2050 is around ~250t (~8,000koz), ~355t (~11,400koz), ~440t (~14,100koz) and ~495t (~15,900koz) respectively. To put these numbers into perspective: The graphic implies that between 2025 and 2050 the demand for Platinum increases from ~250t to ~495t respectively. This represents a ~200% increase in demand over this period. It is interesting to note that JM recorded the highest global gross Platinum demand of 8,752koz occurred in 2013, since then, global gross Platinum demand has averaged around 7,700koz. (This, of course, is prior to any additional Platinum demand, for example, from FC and PEM electrolysis).
Figure 1 also implies, that Platinum demand will likely rise to around 15,900koz or 495t by 2050 (including FC and FCEV). This quantum of Platinum demand is significant when compared to the demand forecast of 7,155koz (226t) for 2022F (WPIC). This difference represents 2.2X the current global primary Platinum supply in 2050. Under these circumstances, an obvious question arises from these assumptions:
Where is the 2.2x additional Platinum supply required to meet this demand going to come from?
I will defer to this question later in this review.
The platinum demand by application, as indicated, for Figures 1 and 2, are the same except for the transition from ICE vehicle catalytic converters to PEM electrolysers, fuel FC and FCEV.
It seems, that the DOE has assumed that PEM water electrolysers take priority over FC and FCEV, but not heavy-duty trucks. It could be argued that since light FCEV are already on the market this assumption is not completely valid. For example, China’s Society of Automotive Engineers is targeting 50,000 FCEV on the road by 2025 (the combined total
of 63,000 targeted by regional programmes) and 1 million by 2030. A growing share of these FC and FCEV will probably go to light- duty vehicles (IEA). In the Chinese Accelerated Transition Scenario (ATS), the total number of FCEV on China’s roads reaches 750,000 in 2030 and 48 million in 2060 (IEA). In the Chinese Accelerated Transition Scenario (ATS), the total number of FCEV on China’s roads reaches 750,000 in 2030 and 48 million in 2060 (IEA).To put these figures into perspective, based on an average estimate of 10gPt/vehicle, for 750,000 vehicles, Platinum demand would be around 240koz in 2030. At 48 million FCEV, based on an average estimate of ~5g Pt/vehicle, Platinum demand, with this additional 50% thrifting, would be lower at around 7,700koz, without additional thrifting this Platinum demand would be over 15moz.
Thrifting of Platinum used in FC and FCEV therefore becomes a critical
ingredient for the effective and efficient transition from ICE to FC and FCEV.
Notwithstanding, the WPIC and IEA (March 2022a, 2021 and 2021) reported that global FC and FCEV demand could see the quantum of Platinum demand reach the parity level of between ~3,000koz and ~3,200koz from 2022F when compared against their 2039 and 2040 forecasts respectively (See Figure 2).
Reaching parity becomes problematic, as recognised by the WPIC in a recent report. The WPIC indicated that when “combined with the additional three million ounces of FCEV Platinum demand could, without increases in supply, cause Platinum scarcity which would hinder FCEV growth rates. However, identified Platinum reserves and resources are significant and production can be expanded with time to satisfy demand growth”.
It is important to note that demand for Platinum (PGMs) is inextricably linked to the introduction of vehicle regulation and standards for controlling the tailpipe emission of harmful gases (US Clean Air Act of 1970). Vehicle emission standards have been progressively tightened through regulation worldwide since 1970. In response, vehicle manufacturers have had to increase the content (loading and load ratios) of Platinum, Palladium and Rhodium in autocatalysts to meet these stricter limits, especially for heavy-duty vehicles (HDV). The price mismatch between Palladium and Platinum together with enabling technology has paved the way for Platinum substitution in petrol-driven vehicles, hence boosting Platinum consumption. In this regard, the additional demand for FC and FCEV together with hydrogen demand will undoubtedly put increased pressure on supply.
I question the assumption that with time, Platinum (PGM) reserves and
resources can be expanded to satisfy demand growth. In my view, this opinion, which is held by many in the industry, is over optimistic. In fact, I expect a decline in global Platinum (PGM) supply, particularly from South Africa and Russia.
There are a number of future global Platinum supply-and-demand estimates that have been published, each with its own assumptions. In my opinion, although demand estimates are important, the:
Global quantum of primary mine Platinum (PGM) supply is crticial with regards to achieving global decarbonisation and net zero emission targets by 2050, in the vehicle, other transport and industry sectors.
Figure 3 illustrates FCEV Platinum demand for passenger vehicles between 2030 and 2040. In this regard, SFA (Oxford) “assumes FCEV loading of 30g in 2017 reducing to 12g by 2021 and to 6g by 2030, with the latter number broadly equivalent to the Platinum loadings on today’s diesel passenger vehicles. On this basis, demand for Platinum would grow to 140,000 ounces in 2030 and reach 1.9 million ounces by 2040”.
It is noted that there is around 1,000koz between these estimates, which is likely attributable to SFA’s (Oxford) focus on passenger vehicles only. Heavy vehicles (HV) are also included in the WPIC figures.
Demand from chemical, glass and electronic applications together with the other industrial sectors will also rise over time, as expected, particularly from the chemical and glass sectors, thereby putting further pressure on supply (Figures 1 and 2).
PGMs are also expected to play a critical role in emerging energy efficiency and renewable energy applications, such as PEM water electrolysers as well as many other electrocatalytic conversions such as the conversion of nitrogen to ammonia and carbon dioxide to chemicals and fuels.
Heraeus indicated in its recent Appraisal (27 June 2022) that “green hydrogen may also be used in the production of green e-methanol synthesis. E-methanol is currently the most suitable alternative to power shipping. Shipping accounts for 2%-3% of global carbon dioxide emissions through the burning of fuel oil and can be a net-zero fuel if green e-methanol is used”. As a further example of electrocatalytic conversion, the WPIC has also recently reported that “Aviation kerosene is the fuel of choice for most Platinum-based electrolysers as it is instrumental to the production of sustainable aviation fuels“. According to aerospace group Airbus, green hydrogen production capacity could achieve an estimated 50-fold increase in the next six years. This means green hydrogen could be on track to supply up to 25% of the world’s energy needs by 2050. According to the WPIC, cumulatively, over the next 15 years, Platinum demand from electrolysers is likely to be between 1moz and 2moz, depending on the development of new technologies over that period.
By way of a further example, Australia’s biggest PEM electrolyser, with a contract value of about US$4.1 million, to provide green hydrogen to a fleet of heavy-duty fuel cell electric vehicles (FCEVs), which also use Platinum group metals (PGMs) to catalyse the conversion of hydrogen into electricity for vehicle mobility, is expected to be delivered in the third quarter of 2023.
Note, Figure 1 implies that the WPIC figure for green hydrogen production may be over conservative. Figure 1 shows rising Platinum demand for PEM water electrolysers to a Platinum consumption rate of some ~800koz, ~1,300koz and~1,900koz by 2030, 2040 and 2050. In this regard, there seems to be an underestimate by some in the industry of the future demand for PEM water electrolysers compared to the DOE’s estimate.
The obvious “repeated question” then follows from this conversation:
Where will the additional Platinum come from to satisfy the needs of the other Platinum demand sectors, including additional Platinum used in FCEV and PEM water electrolysers?
Simply put, assuming no limitations, and using the Platinum demand estimate associated with the introduction of FCEV by 2039 (WPIC), plus the DOE estimate for Platinum consumption required for the manufacture of PEM water electrolysers over the same period, Platinum demand by 2040 amounts to an estimated ~4,300koz, which is in excess of the corresponding demand for Platinum for ICE emissions control of around 3,100koz in 2022F. In this regard, the DOE’s Platinum demand for the transition from catalytic converters to FCEV may be said to be low.
The rising demand for PEM water electrolysers should, however, not be discounted. This component does not appear in well-known PGM research organisations’ public supply-and-demand literature.
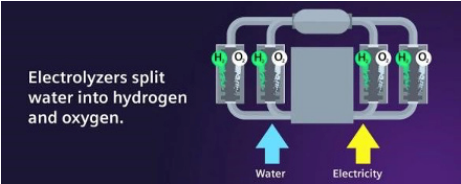
Siemens Energy: Schematic of PEM and Alkaline Electrolysers
I assume that PEM water electrolysers are grouped in the “other” segment as the manufacture of PEM electrolysers is still in its infancy stage, Figure 1.
Without going into the technological details, there are currently two commercially relevant electrolysis technologies on the market that are implemented for the production of green hydrogen: PEM and alkaline electrolysis (current share 50:50, Heraeus). The PEM electrolysers use Platinum in both the anode and cathode.
As an aside, South African researchers Hydrox, have recently made a breakthrough by incorporating PGMs in the catalytic coatings of the electrodes of an alkaline electrolyser. Hydrox has been able to achieve significant advances in efficiencies as a result.
The IEA, WPIC, IHS and DOE and others have raised concerns about the likelihood of bottlenecks in the future supply of Platinum (PGMs). In general, FCEV require more Platinum (PGMs) than ICEs, though the amount needed in FCEV has fallen in recent years by the application of technology, which has led to the thrifting (reducing) of Platinum (IEA, 2021a). Probably, the most quoted example of thrifting comes from Toyota. Toyota was able to reduce Platinum loading by about one-third between the first-generation model of the Mirai car in 2014 and the second-generation model that came out in 2020.
The IEA indicates that if “further thrifting” is successful, switching to FCEVs in China and the rest of the world could substantially reduce global demand for PGMs. The IEA estimates that the “deployment of FCEVs in China leads to a reduction of over 80% in national demand for PGMs in 2060 compared with 2020, assuming innovation to continue reducing Platinum loading. Without such innovation, PGM demand would increase by about 140% from 2020 to 2060, despite the almost
complete elimination of PGM demand for ICEVs due to their replacement with alternative drive trains”. Furthermore, it should be noted that PEM water electrolysers use relatively small amounts of Platinum and are built to last, meaning infrequent replacement and availability for recycling between 10 and 20 years (DOE 24 February 2022).
Perhaps the DOE’s assumptions/implications, as discussed above, that PEM water electrolysers take priority over FC and FCEVs but not heavyduty trucks are not so far out after all.
The conversation thus far centres on two of the many barriers which have to be overcome before the full force of decarbonisation can be achieved through the introduction of FC and FCEV in the vehicle industry.
These are:
Thrifting FC and FCEV Platinum (PGM) loading further becomes a must. The primary mine supply should increase to support demand, alas it will not, in my opinion.
Under these circumstances, the mismatch between Platinum (PGM) supply and demand will very likely require a change in the “Systems Architecture”. Simply because there is not enough Platinum (and Iridium) to satisfy total demand. Giant gains in innovation, technology and the use of alternatives will be required to meet Platinum demand, while at the same time achieving global decarbonisation.
As indicated, it should be noted that many prominent organisations such as the IEA Net Zero by 2050 A Roadmap for the Global Energy Sector October 2021, World Energy Outlook 2021 and Wood Mackenzie have examined multiple alternative pathways to ultimately achieve 100% net zero, BE vehicles being one of them. However, there are also huge barriers associated with the primary supply and recycling of lithium.
Global Platinum supply to 2050
Turning the discussion from global Platinum demand estimates to global Platinum supply estimates from 2022 to 2050 completes the picture with regard to a mismatch between the future quantum of Platinum supply and demand.
Figure 4 on the next page illustrates the future primary mine supply, primary mine supply plus recycling and demand for global Platinum to 2050, in tonnes/year. (Northam Platinum and The US Department of Energy’s report of 22 February 2022 respectively). Figure 5 represents the WPIC (Metal Focus) forecast for Platinum supply by region for 2022F.
Figure 4 integrates three independent forecasts: Global primary Platinum (PGM) mine supply, secondary supply (recycling) and demand.
The graphic shows a significant decline in global Platinum primary supply, represented by the yellow line on the graph, of approximately ~ -174% from ~176t to ~101t (5,650koz to 3,250koz) between 2025 and 2050. Over the same period, the demand for Platinum increases from~250t to ~495t, this represents a ~200% increase in demand.
The decline in supply of around ~-174% combined with a ~200% increase in demand between 2025 and 2050, illustrates a significant and increasing mismatch between the future quantum of Platinum supply and demand, while at the same time striving to achieve global decarbonisation.
Figure 4 also illustrates, as indicated, global primary supply plus total recycling, represented by the mauve line, and demand. In this regard, the future Platinum supply and demand market balance can be approximated. The graphic shows an ever-widening market balance
(excluding FC and FCEV demand). The widening market balance is accelerated significantly when FC and FCEV demand is included by approximately: ~30t 1,000koz, ~100t 3,200koz, and ~115t 3,700koz in 2030, 2040 and 2050 respectively.
Figure 5 represents the WPIC (Metal Focus) 2022F global forecast Platinum supply by region and distribution. Figure 5 has been included for comparative purposes. Note that South Africa, Russia and Zimbabwe represent some 73%, 10% and 8% of global Platinum supply respectively.
In this regard, it is immediately obvious that over 90% of the world’s platinum supply comes from just three countries. This geographical and
political concentration of supply can be described as ‘precarious’ at best.
Russia-based Afromet has withdrawn from the Great Dyke Investments joint venture with Kuvimba Mining House that was developing a new large independent underground platinum mine, the Darwendale platinum project in Zimbabwe. Afromet’s pull out from the USD3bn project is due to the global sanctions imposed on Russia by Western countries, which is also applicable to Russian investments abroad. The company was fully owned by Vi Holding, a Russian investment and industrial group. The Darwendale mine was designed to produce some ~860koz of PGMs per annum at its peak. This project will remain on the back-burner until sufficient funds are available.

As far as Russian PGM primary mine supply goes, I am of the view that challenges in logistics, deliveries of equipment, spares, consumables and sanctions due to the Russian invasion of Ukraine will take their toll in the medium to long term. It is worth noting that Russian imports in general, have dropped over 40% since the invasion and stockpiles of vital imported manufacturing components are likely to be depleted in the next three to six months. Car production is also down by 60% and Russia’s Transport Minister has admitted that the country’s logistical infrastructure is now “broken” as a result of sanctions.
In fact, supply chain disruption is already happening. Nornickel reported (2 August 2022) that its sales of Nickel, Palladium and Platinum fell in the first half of 2022 due to disrupted supply chains, and it is facing problems with logistics and supplies of imported equipment.
Similarly, plans to develop the Chernogorskoye deposit and southern part of Norilsk-1 will also likely depend on the company’s ability to overcome these limitations. In this regard, the continuity of risk to primary supply is to the downside.
I am of the opinion that global primary mine supply is in a continuous longterm decline (see: Figure 4, yellow line). This situation may be attributed to a number of reasons, particularly due to the lack of investment capital to exploit underground resources on the South African Platinum (PGM) mines. This is despite the enormous 6E resources reported by the Platinum (PGM) mining companies in their annual mineral reserve and resources reports. The mining of these resources at depth will likely require a significant amount of time to bring into commission. In my view ~10 to ~15 years. Furthermore, the possibility of the development of a new large independent underground Platinum mine in South Africa is slim.
All three of these countries (South Africa, Russia and Zimbabwe) operate in a politically toxic and high-risk environment to varying extents and are not likely to attract investment to capitalize new mines. Platinum may therefore be described as a diminishing resource in the medium to long term.
In this regard, the projected increase in Platinum (PGMs) demand to achieve global decarbonisation will be exasperated by a likely long-term decline in global Platinum (PGMs) supply.
Will secondary recycling supply support the decline in mine supply?
Growth in the secondary supply of Platinum (recycling) from 2011 to 2020 was virtually flat (average 1.2moz). The quantum of Platinum autocatalyst recovered by recycling is not expected to grow significantly going forward (2025) as Platinum loadings are historically lower in light vehicles that are about to be scrapped, given the average age of lightduty vehicles is around 12 years (WPIC). In comparison, the quantum of Palladium autocatalysts recovered by recycling is expected to climb to over 4moz by 2025 from around 2moz (JM, Amplats).
The DOE (24 February 2022), however, reports that technological and safety barriers to recycling notwithstanding, there is a lack of scalable, tailor-made recovery systems for the PGM-containing membrane electrode assemblies in PEM electrolysers and fuel cells. The DOE also reports that “PGM currently supplied by secondary sources will decline as the use of catalytic converters is replaced by electric and fuel cell vehicles over time, reducing PGM supply for other applications. While PGM recovery from end-of-life PEM electrolysers and fuel cells could be possible, these technologies will not enter the secondary market for 10-20 years from when they are first commercialised at scale. Also, technologies for PGM recovery from these products are
underdeveloped”. In this regard, I have assumed secondary recycling supply will likely rise at a CAGR of 4% initially as Platinum vehicles are scrapped. This rate is, however, offset when based on primary mine supply, Figure 4.
In this conversation thus far, I have shown graphically, using independent forecasts that the future quantum of global demand for Platinum (PGMs) significantly outweighs the global supply of Platinum (PGMs) from 2023/2024 onwards, which will result in a market deficit. This increasing and continuous deficit will undoubtedly support the price of Platinum, ceteris paribus.
Many experts in the industry are relying on the extensive thrifting of platinum (PGMs) in FC, which has been proven to a greater extent. The IEA, however, also emphasises the need for further innovation, which will continue reducing Platinum loading in FC to over 80% and more, from a 2019 base case. The emphasis on R&D to achieve “further thrifting” is a common priority theme among many in the industry.
I have also taken the view, as indicated, that the global Platinum (PGMs) supply is in decline. I will refer to the high-risk impediments surrounding both Platinum (PGMs) supply from the South African and Russian mining industry further in this discussion.

Further to Future Mine Supply
The consequential requirement for additional Platinum for FC, FCEV and green hydrogen for other transport and industries in the short, medium and long term sits squarely on the future primary and secondary supply of Platinum.
I am of the opinion that the decline in global Platinum mine supply has not been given the attention it deserves by some industry research organisations and investors; after all, the market balance equation relies on both supply and demand. These organisations seem to ‘shy away’ from this subject and focus mainly on the demand side of the supply-and-demand equation. A deficit in the market balance will put significant upward pressure on the price of Platinum.
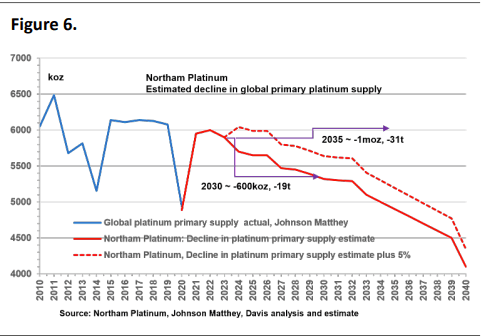
Figure 6 illustrates Northam Platinum’s estimated decline in global primary Platinum supply from 2020 to 2040. Also illustrated, is a 5% upper limit based on this decline. The graphic shows a significant decline in global Platinum primary supply declining around ~-600koz by 2030 and ~-1moz by 2035. The decline steepens sharply after 2032.
It is important to note that the exact rate of decline is not a pivotal factor in this equation, the rate of decline only delays the timing of
when the point of “no return” is reached and the quantum of Platinum supply becomes insufficient to achieve full global decarbonisation. It is worth noting that peak global Platinum mine supply was achieved in 2006 at 6,830koz (JM). I am of the view that this level of Platinum mine production is not likely going to be achieved again nor sustained or increased.
when the point of “no return” is reached and the quantum of Platinum supply becomes insufficient to achieve full global decarbonisation. It is worth noting that peak global Platinum mine supply was achieved in 2006 at 6,830koz (JM). I am of the view that this level of Platinum mine production is not likely going to be achieved again nor sustained or increased.
from South African Platinum mine supply from 2023 will likely be approximately ~-480koz by 2030 and ~-760koz by 2035. Note, these figures are based on past results. SFA (Oxford) indicated that “the reserve depletion rate of around ~125koz p.a. of Platinum on the South African Platinum mines remains a feature in mine profiles”. In this regard, this decline represents a decline of around ~870koz by 2030 and ~-1.5moz by 2035. Note, SFA’s (Oxford) rate of decline is higher than the ~-1.4% CAGR, the range of the decline of these two estimates to 2030 is between ~-480koz and ~-870koz by 2030, similarly the range of decline to 2035 for these two estimates is between ~-760koz and ~-1.5moz. Even though the spread between the decline in mine supply is relatively large, the decline in South African mine supply is obvious.
I am of the view that South African Platinum mine supply will continue to decline at a CAGR of ~-1.4%, at least over the long term. This will tighten the supply market and put upward pressure on the price of Platinum.
South African Platinum (PGM) reserves are undergoing a “long-term structural change” and much depends on ore reserve replacement, which will require significant capital expenditure. I expect the longterm decline in Platinum mine supply is due to a combination of factors: These factors include the declining grade of the three reefs over time, the unequal depletion of reserves and the historical evolution of the mining mix ratio of the PGM reefs to higher mining ratios of the UG2 Reef (which has lower Platinum grades when compared to the Merensky Reef and Platreef).
This is despite the enormous 6E resources reported by the Platinum (PGM) mining companies in their annual mineral reserve and resources reports.
Figure 7, below, illustrates the diminishing mineral reserves of Implats’ 20-year life of mine (LoM) profile. Only LoM I is based on mineral reserves, while LoM II and LoM III have not been converted to mineral reserves.

The LoM profile implies that mine supply will likely have declined by roughly ~30% or ~1moz by 2030 and by around ~66% or ~2.0moz by 2035. Note that a large proportion of the 20-year plan is still at resource levels II and III, and would require an improved financial outlook, further studies and a significant amount of capital to convert these resources into reserves. Feasibility studies are continuing at Impala Rustenburg, Two Rivers, Zimplats, Marula, Mimosa and the Waterberg project to evaluate future opportunities.
This is just one long-term example of the diminishing reserves in the South African Platinum mining industry (Company Mineral Resource and Reserve Statements).
South African miners began to invest in reserve replacement in 2021. This quantum of investment is, however, unlikely to stave off the overall decline in Platinum supply or return the Platinum markets to surplus. As far as Russian PGM primary mine supply goes, I believe that challenges in logistics, deliveries of equipment, spares, consumables and sanctions, due to the Russian invasion of Ukraine, will take their toll in the medium to long term.
There are several additional factors that are likely to accelerate the decline in Platinum supply, in particular the loss of PGM supply associated with South Africa’s looming energy crisis (Eskom). The investment and political climate in South Africa is just not conducive to the commitment of large amounts of capital and there is a distinct lack of appetite from investors. Some industry research organisations and investors “brush away” the consequences of South Africa’s looming energy crisis, however it is very real. A continuous decline in mine supply will put the market into deficit which in turn will put upward pressure on the price of Platinum.
It would seem that many potential investors are missing this piece of the puzzle which is of critical importance when assessing investment opportunities in Platinum.
There is an assumption in the industry that the supply of Platinum is plentiful and easily accessible, arising from the future development of PGM resources in South Africa (especially) and Russia.
In my view, this development will likely not occur in the medium to longer term. Furthermore, the possibility of the development of a new large independent underground platinum mine in South Africa is very slim.
Looming Energy Crisis in South Africa:
At this stage of the conversation, it is also important to put into perspective the potential impact of the energy crisis on South Africa’s platinum mine supply. South Africa is experiencing higher frequencies and higher stages of load shedding, as Eskom’s ageing power stations are continually breaking down and becoming increasingly inefficient.
I believe that frequency and stages of load shedding will widen significantly over the next five years, caused mainly by ‘slippage’ in the new build programmes and capital constraints. This, together with political interference, meddling, corruption and vacillation with respect to the recovery plan will continue to be Eskom’s and the government’s main downfall. Load shedding does not only cause downtime losses on the South African Platinum mines but also has an impact on mine equipment, maintenance costs and smelting. Refining operations in particular are sensitive to load shedding. Natascha Viljoen CEO of Anglo American Platinum said in a recent interview that “the company would be challenged to move all of our metal in refining for the rest of the year if Eskom implements higher frequencies of load shedding Stage 6’’.
Furthermore, the CEO of Eskom, André de Ruyter, has indicated an additional and significant risk to its transmission infrastructure. This risk is associated with the ageing infrastructure and insufficient transmission infrastructure, especially in the west of the country. De Ruyter indicated that the expansion and strengthening of the transmission system will require ~R130bn to build 100 new substations and 8,000km of new transmission lines by 2030. In my view, this cost comes close to putting the final nail in the coffin as far as Eskom’s and the government’s ability to achieve its plan in a timely manner is concerned.
The private sector is beginning to mobilise in order to reduce the risk of power shortages by investing in energy renewables: solar, wind and battery power. Anglo American in partnership with EDF Renewables, for example, has recently announced a renewable ecosystem which will increase capacity by 3GW to 5GW.
There are also numerous additional risks boiling beneath the surface in South Africa, which are likely to result in social and political unrest as the country edges closer to the 2024 general election. This is mainly due
to the lack of service delivery, corruption, looting and incompetence throughout South Africa’s public sector. These hallmarks of ANC misrule mean that almost everything linked to the state is literally falling apart.
According to data compiled by the Minerals Council South Africa, the socalled Southern Cluster Mines on the eastern limb: Glencore’s chrome mines, Two Rivers Platinum, Dwarsrivier, Amplats’ Mototolo platinum mine and Northam’s Booysendal mine lost around ~R1.25 billion in revenue last year due to social unrest and “community” protests. The twin scourges of unemployment and state failure are the main drivers of unrest, which is often ginned up by shadowy procurement mafias and other criminal elements seeking to shake down the sector (Ed Stoddard DM).
Social unrest is a material risk to the sector, toxic to investors and dangerous for employees and communities, the stakes are sky-high and the risk to the continuity of Platinum supply is to the downside.
Despite these barriers, the world is moving at pace towards a low carbon future. Clean energy, like wind and solar, are now the cheapest sources of electricity in most countries: Many of the world’s vehicle manufacturers are shifting to make larger quantities of BE vehicles in their quest to meet the net zero rating target by 2050.
More about Thrifting and the Drivers of Platinum and Palladium for FCEV Vehicles
Throughout this conversation I have alluded to references such as the IEA, which have emphasised the need for further thrifting of Platinum contained in PEM FC and electrolysers The IEA indicates that the major
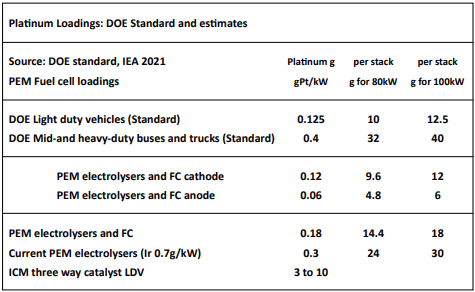
R&D objective for PEM fuel cells is reducing or replacing Platinum. Under these circumstances, the DOE’s Hydrogen and Fuel Cell Technology Office set a technology goal of Platinum usage in light-duty vehicles with 5,000 hours operating life at 0.125 g/kW. At this loading, an 80kW and a 100kW PEM fuel cell vehicle will need approximately 10g to 12.5g respectively. According to the IEA, this number (10g) is approaching the Platinum loading in a three-way catalyst for an ICE vehicle (3g to 7g/vehicle). In this regard, it is perceived that the transition from ICE vehicles to PEM fuel cell vehicles can be achieved if the DOE’s target can be achieved. Plans are in place in Japan to reach 5g per car in 2040 (IEA).
The DOE Hydrogen and Fuel Cell Technologies Office has also set the target of Platinum usage for mid- and heavy-duty vehicles as 2.5kW/ gPt, or 0.40 kgPt/MW for mid- and heavy-duty vehicles.
The IEA is of the view that Platinum demand for FC and FCEV in 2040 will remain dominated by ICE and catalytic converters. It also comments that “If PEM electrolysers were to dominate the hydrogen market, it would increase energy sector demand for Platinum and Iridium. PEM electrolysers catalysts currently use around 0.3kg of Platinum and 0.7kg of Iridium per MW.
Experts believe reductions to one-tenth of these amounts are possible in the next decade in order to minimise costs (Kiemel et al., 2021). A separate approach in development, using anion exchange membranes, could avoid the use of these metals altogether”.
But what about Iridium?
In a recent report the IEA said: “A key barrier to the adoption of PEM water electrolysers for production of hydrogen is the high Iridium content of currently state-of-the art electrolyser anodes.” This is due to the fact that Iridium accounts for ~1% of PGM of primary supply, Iridium content reductions of as much as 80-90% will be needed to support this technology. Challenges to overcome include: 1) advancing technology to achieve an anode catalyst loading of 0.05gIr/kW or lower; 2) establishing a PEM water electrolyser recycling and Iridium recovery infrastructure; and 3) achieving end-of-life recycling rates of 90%” (IEA).
In this report, I argue that global mine supply is limited and in decline, and I am of the opinion that it is important to get a “sense or an estimate” of the average Platinum loadings, and hence additional Platinum demand which will likely be required as the transition from ICE to FC-based vehicles increases over time, without limitations of Platinum supply. It is obvious that the minimum amount of Platinum content in FCs will be the target. Figure 8 illustrates a simplified Platinum demand model
with the dependency on vehicle production and average FC platinum loading. Figure 8 also illustrates a forecast of Platinum demand, by application, and in particular autocatalyst demand for 2022F (WPIC). The graphic shows that this quantum of Platinum is around ~3,100koz, which is equal to the Platinum demand forecast of the WPIC for 2022F (red dotted line). This means that should the average Platinum loading of FCs result in any quantum in the range of parity it will stall the goal towards global decarbonisation due to diminishing Platinum supply. This calculation is focused on FC vehicles and excludes the Platinum demand that will be required for other transport sectors such as trains, ships, stationary applications, PEM electrolysers and other uses.
I am therefore of the view that the need for to additional thrifting of FC Platinum loading to at least 2gPt/kW and below is required, possibly down to the Platinum loading of electrolysers at 0.3gPt/kW (note that I have excluded Iridium).
I am therefore of the view that the need for to additional thrifting of FC Platinum loading to at least 2gPt/kW and below is required, possibly down to the Platinum loading of electrolysers at 0.3gPt/kW (note that I have excluded Iridium).
In terms of market penetration, the policy-based versus commercially enhanced scenarios equate to 2% – 3% of global annual vehicle production by 2030, increasing to 8% – 11% by 2040. Under these circumstances, I am of the opinion that the annual rate of FCEV production, indicated by the WPIC, is over optimistic and will likely stall the goal towards global decarbonisation without further thrifting (Figure 8).
The Water Fall Chart, Figure 9, illustrates the drivers of Platinum and Palladium for vehicles in the Sustainable Development Scenario (SDS) (IEA) between 2019 and 2040. Figure 9 shows the impact of expanded vehicle regulation (loading) on the quantum of Platinum and Palladium, which for Platinum is estimated to be ~around 1,600koz. Figure 9 also illustrates the reduction in Platinum of ~-800koz used as the transition from ICE to FCVs and FCEVs progresses (fewer ICE sales). It is of note that without thrifting some ~460t or 14.8moz of Platinum would be required to meet demand for vehicles by 2040.
As indicated, increased innovation and technology advances to minimise the use of Platinum and its associated costs are a pivotal factor in determining the rate of transition to FC and FCEV. Targets for reduced Platinum loading (described above) in g/kW have been set by the US DOE, including targets for trucks, which require three times more power than light vehicles. If these targets are met, demand for FC and FCEV in the SDS would reduce Platinum demand to just over ~100t or ~3,500koz by 2040 (IEA). Figure 9 implies an average thrifting rate of ~-76%. This quantum of Platinum demand is just above the parity level for 2022F of between ~3,000koz and ~3,200koz when compared
against the WPIC 2039 and 2040 forecasts respectively. According to my assumptions, described above, the level of thrifting is still not high enough, so basically, the DOE Standard should, in my view, be lowered considerably
This result complements my calculations and conclusions and effectively demonstrates once again that with the transition from ICE to PEM and PEM electrolysers that there will be a shortage of Platinum and further significant thrifting is required over and above the DOE standard. Notwithstanding the Platinum demand required for other transport and industry sector requirements, such as chemical, rail shipping, aviation, transport and stationary fuel cells to name but a few.
Green hydrogen, Electrolysers and Energy Security
Global decarbonisation has become synonymous with Platinum and green hydrogen. But what is green hydrogen? Green hydrogen is defined as hydrogen produced by splitting water into hydrogen and oxygen using renewable electricity (electrolyser). Green hydrogen has significantly lower carbon emissions than grey hydrogen.
Just as Platinum is inextricably linked to the introduction of vehicle emission standards, which have been progressively tightened through regulation worldwide since 1970, green hydrogen has now become a key pillar of decarbonisation for industry.
Bridget van Dorsten, Research Analyst, Hydrogen and Emerging Technologies at Wood Mackenzie, Global Green Hydrogen Markets, expects the “market to more than double from below 100 Mt today to 223 Mt by 2050. Low-carbon hydrogen will both displace existing fossil-intensive demand and create new markets’’. The cost of green hydrogen is set to plummet as demand soars – but policy support and investment of at least US$600 billion is required.
Furthermore, energy security and net zero commitments will drive demand in many sectors such as power, steel, shipping and aviation. Ammonia is seen as the most promising industrial consumer of hydrogen and is set to account for 48% of demand by 2025. The IEA has indicated that international cooperation and sharing of best practices, including policy frameworks, are vital to achieving global net zero emissions by 2050 (IEA, 2020b).
Most major countries have adopted an accelerated transition scenario (ATS) policy to meet the transition to low-carbon energy sooner rather than later. China unveiled its long-awaited national blueprint to develop
a clean hydrogen industry on 23 March 2022, setting out a near-term production target while pledging to increase the use of low-emission fuels across various sectors [Announced Pledges Scenario (APS)]. This policy includes a development plan to build a low-cost hydrogen supply chain between 2021 and 2035, laying out a series of policy guidelines at national level for the first time. China is the world’s largest GHGemitting nation and is aiming for peak CO2 emissions by 2030 and carbon neutrality by 2060.
Since the Russian invasion of Ukraine there has been a major shift in policy surrounding energy dependency. In this regard, many countries are investing in low-carbon energy to bolster security. This means more renewables, particularly investment in green hydrogen. Europe is boosting its green hydrogen ambitions as it looks to secure energy independence and has increased targets for production and imports of the gas by 15 million tonnes per annum.
The European Commission has set out its RepowerEU proposals to ensure Europe is independent from Russian fossil fuels before the end of the decade.
The European Commission has set out its RepowerEU proposals to ensure Europe is independent from Russian fossil fuels before the end of the decade.
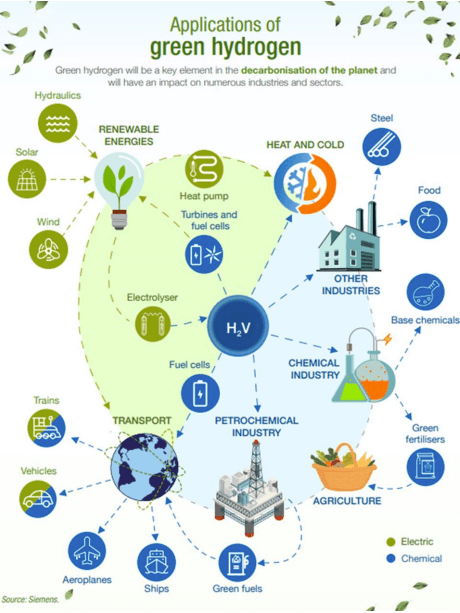
The applications of green hydrogen are numerous and growing.
Greenhouse Gas Emissions
The largest source of GHG emissions (mainly carbon dioxide) come from human activities such as burning fossil fuels for electricity, heat and transportation. The transportation sector generates ~ 27%, the largest share of GHG, primarily arising from burning fossil fuel for lightduty cars, trucks, ships, trains and planes. Over 90% of the fuel used for transportation is petroleum based, which includes mainly petrol and diesel (EPA 2020). Most importantly, the heavy-duty vehicle segment, which accounts for only 10% of the global vehicle fleet, is responsible for emitting 43% of GHG (ICCT).
In this regard, HD FCEV goods trucks and buses are the prime target market for FCEV as they represent the biggest opportunity for reducing vehicle GHG. Additionally, they are deemed to be harder to electrify with batteries. Also, batteries take up more space in a HD goods truck and would take hours to recharge. Notwithstanding, HD FCEVs have a
longer range when compared to BE vehicles (Powercell).
Substitution and ICE Autocatalyst Loadings
The price mismatch between Palladium and Platinum together with enabling technology has paved the way for Platinum substitution for Palladium in petrol-driven vehicles, hence boosting Platinum demand. Substitution has also gained momentum on fears that Palladium availability will be affected by the Russian invasion of Ukraine. Enabling technology supports a 1:1 substitution ratio of Palladium for Platinum.
Sibanye-Stillwater forecasts that Platinum substitution in light petrol vehicles will likely increase demand by around ~1.5moz by 2025. By
extrapolation, this quantum approximates to between ~250koz and ~300koz forecast for 2022F. Amplats last year estimated around ~75koz were substituted and expects ~200koz to be switched this year (2022). It also indicted that the market expects up to ~1moz of Palladium switched for Platinum, which could be reached in four to five years. In recent articles (July 2022), the WPIC and Metal Focus presented two scenarios at higher levels of Platinum substitution, at 30% and 50% respectively. Their calculations implied that these levels would result in additional Platinum demand of between ~512koz and ~853koz p.a. respectively, given the assumption that substitution occurs on only c. 20% of annual vehicle sales.
In time, the industry will face a conundrum as substitution in petrol autocatalyst converters will effectively compete with the additional Platinum required for FC, FCEVs, PEM electrolysers and green hydrogen. In this regard, the additional platinum demand will put pressure on
supply which will in turn, contribute to the market balance deficit (Figure 4).
Note also, the level of substitution is not uniformly adopted by vehicle manufacturers globally.
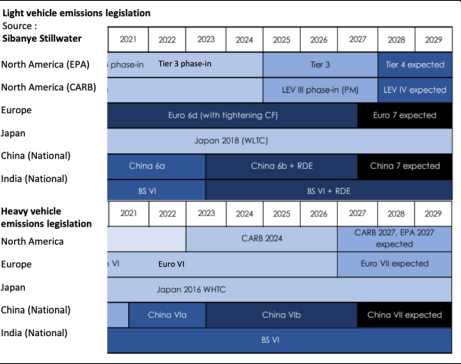
As indicated, the demand for platinum (PGMs) is inextricably linked to the introduction of vehicle regulation and standards for controlling the tailpipe emission of harmful gases (US Clean Air Act of 1970). Vehicle emission standards have been progressively tightened through regulation worldwide since 1970. In response, vehicle manufacturers have had to increase the content (loading and load ratios) of platinum, palladium and rhodium (PGMs) in autocatalysts to meet the stricter limits, especially for heavy-duty vehicles (HDV). Additional vehicle emission standards for light- and heavy-duty vehicles will continue to tighten.

See table below (Sibanye-Stillwater).
The additional quantum of PGM autocatalyst loadings is significant
despite the expected increase in battery electric (BE) vehicles. Figure
9, above, implies that the increase in emission standards is likely to
increase Platinum loadings and hence Platinum demand by around
~1,600koz. Under these circumstances, the market balance deficit will
deepen, again forcing upward pressure on PGM prices.
Substitution, together with additional autocatalyst loading, will have a significant role in maintaining the ever-increasing Platinum market
deficit from 2023/2024. This scenario will also be supported by the transition to hydrogen fuel cell and green hydrogen technologies, particularly in the case of Platinum demand.
It becomes obvious that global PGM mine supply, particularly Platinum mine and secondary recycling supply, will not be able to support both substitution and additional Platinum loadings. Notwithstanding the additional Platinum required for FC, FCEV, PEM electrolysers, green hydrogen and other transport and industry sectors. Furthermore, this result provides further evidence to support a hike in the Platinum price.
International Co-operation, Dependency and Accelerated Transition to Low Carbon Emissions
The intention of this report is to touch on the enormity of the barriers surrounding the global introduction of low carbon emissions and net zero emissions by 2050. International co-operation and sharing of best practices, including policy frameworks and pathways, are vital to achieving this goal (IEA, 2020b). Wood Mackenzie suggests that getting to net zero by 2050 will cost around USD60 trillion in technologies and innovation. Most major countries have adopted an accelerated transition scenario (ATS) policy to meet the transition to low-carbon energy sooner rather than later.
From this summarised conversation it is apparent that there will likely be significant demand for Platinum and green hydrogen as many countries strive to achieve low carbon emissions and energy dependency. Furthermore, the industry is investing heavily in new innovative technologies aimed at improving efficiencies while minimizing Platinum (PGM) usage and costs.
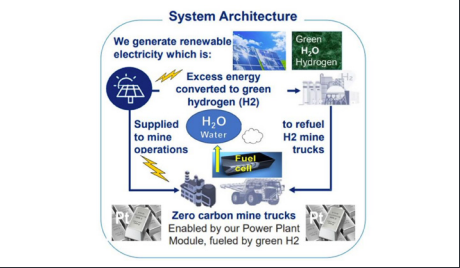
Introducing the nuGen™ Truck and System Architecture
I focus on the “System Architecture” required to operate the green hydrogen-electric powered, zero emission, mine haul truck (FCEV). Anglo American Platinum launched the world’s largest, lightest green hydrogen-powered zero emission mine haul truck (510t), which can carry up to 290t of ore at its large Mogalakwena open-pit PGM mine near Mokopane in Limpopo Province, South Africa, on 5 May 2022, The following description of the nuGen™ truck and system architecture was obtained from Anglo American Platinum.
The 2MW hydrogen-battery hybrid truck, which generates more power
than its diesel predecessor, is part of Anglo American’s nuGen™ Zero Emission Haulage Solution (ZEHS) that was developed as part of its Future Smart Mining strategy.
The nuGen™ provides an end-to-end fully integrated green hydrogen system, consisting of production, fuelling and haulage systems with green hydrogen, which will be produced at the mine site.
Anglo American indicated that 80% of the diesel consumption at its large mines globally is through the use of large trucks. In this regard, Anglo American had to build a full ecosystem which consisted of a solar photovoltaic site, an electrolyser and a refuelling system to create a zero-emission haulage system at the Mogalakwena open-pit PGM mine. A schematic of the system architecture is illustrated in the figure below.
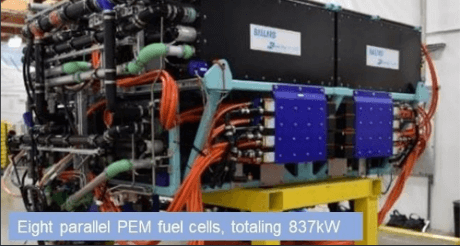
A Komatsu 930E-4 ultra-class haul truck was converted to allow it to run
on hydrogen, which involved the truck’s original diesel 2,700 hp diesel engine being replaced with eight parallel PEM fuel cells (fuel stacks), totalling 837kW, and a 1.2MW lithium-ion battery power system.
Only water is emitted from the converted truck during 24/7operations. This single 930E-4 ultra-class haul truck, unconverted uses around 3,000 L/d of diesel and consumes over 900,000 litres of diesel a year, which equates to enormous amounts of carbon emission – extrapolating this up to the carbon saving from Mogalakwena’s fleet alone, besides Anglo’s wider mining truck population – the potential is massive, said Julian Soles, head of technology development, mining and sustainability. Furthermore, a new drive train had to be installed and integrated into the truck’s control systems.
The nuGen™ truck also allows for the downhill recharging of the lithiumion battery power system so as not waste potential regenerative energy that would normally be dissipated as heat into the atmosphere. Anglo American indicated that harvesting the regenerative energy created when driving downhill reduces the need for external energy.
This energy is stored in the battery, together with the hydrogen, which extends the truck’s range and reduces the out-of-cycle time for the truck, since hydrogen refuelling is significantly faster than recharging batteries.
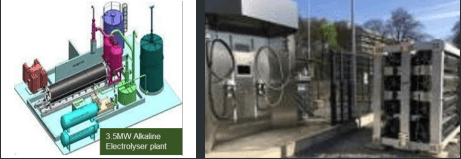
A key component of the green hydrogen initiative at Mogalakwena is plentiful solar power and this will be provided by a 100MW solar plant, which is expected to go into construction later this year and to be operational by the end of 2023. The nuGen™ project at the Mogalakwena mine will use the power from the solar plant to supply a 3.5MW alkaline electrolyser plant. Hydrogen production from the electrolyser plant will be stored in tanks with a total capacity of 800kg at 500 bar of pressure. The hydrogen is not converted to a liquid at any point in the process, instead it stays in a gaseous state and is transported at a high pressure. The initial 3.5MW pilot plant will produce one tonne of green hydrogen a day to power the fuel cell truck.
The nuGen™ hydrogen-powered truck carries 68kg of hydrogen on board, which is sufficient to operate the truck for one to two shifts, depending on the load. Refuelling takes place at a hydrogen “pump” for about nine minutes before the truck gets back to work. Amplats plans to extend its refuelling facilities once more trucks are retrofitted with hydrogen and reach commercial operation stage.
The truck comes equipped with new safety features, including crackable glass where hydrogen can escape if necessary. To manage the voltage on the vehicle, Anglo American did a number of modifications and designed a radiator especially for this application, to manage thermal aspects of the fuel cells. The truck also has a specialised filtration system to limit dust and sulphur reaching the fuel cells.
Anglo American’s technical director, Tony O’Neill, stated that while the total cost to operate will be comparable to diesel, the system will achieve direct parity by 2030, adding that the FCEV trucks will allow for 50%-70% reduction in emissions (Scope 1 and 2 for open-pit mines). Anglo American also said that it has seven sites in planning for rollout
completion by 2030, including the Los Bronces and El Soldado copper mines in Chile. At Mogalakwena, a full 40 truck rollout is planned to start in 2024. Hydrogen-powered trucks are also on the cards for its Kumba Iron Ore operations in South Africa, which include both the Sishen and Kolomela mines.
Anglo American is targeting, through thrifting and advances in technology, for each PEM fuel cell stack to likely require around 17g of Platinum or 136g per truck or 0.16g/kw. This Platinum loading target represents a significant level of thrifting, which comes close to the DOE target of Platinum usage for light vehicles. For comparison, the DOE target for Platinum usage for mid and heavy-duty vehicles is 0.40gPt/ kW, which amounts to some 335g or 42g per stack, to support eight stacks, against 837kW power output of the current nuGen™ truck. This means that Anglo American’s PEM fuel cell loading target will require a 2.5x reduction in Platinum loading to the DOE target: Achieved through advances in technology.
The prototype truck, however, has a higher PEM fuel cell stack loading. I estimate that the current truck will likely contain around ~424g of Platinum or ~53g per stack.
Platinum Above-Ground Stocks
A drawdown of regional Platinum above-ground stocks? In this regard, the strategic importance of estimating above-ground inventory globally and by region becomes apparent. In my previous review: “China’s Imports Shift Platinum into A Global Deficit, Presenting A Conundrum to The Industry” [March 2022] I discussed the most extreme example of regional Platinum import and export dislocation relating to China. China only imports Platinum and does not export a significant quantum of Platinum. The above-ground inventory in China is widely accepted as being a ‘black hole’ and such inventory is therefore not globally mobile. This above-ground inventory has been building since 2009 and is likely to continue. In fact, the WPIC recently reported that “China is on track to import ~1,378koz in 2022F, more Platinum than its projected needs. China’s Platinum imports continue to run well ahead of its identified demand”. This confirms my assumptions that:
China is literally sucking Platinum continuously out of the system, which will contribute to a tightening of the Platinum market and further contribute to the upward pressure on the price of Platinum as supply dwindles.
This contrasts with the destocking (exports) and redistribution of Platinum above-ground stocks between Europe, North America, Japan and the rest of the world. North America has continuously built-up its above-ground stocks of Platinum since 1993: my estimate implies that North America’s stock is between ~10moz and ~12moz, a similar quantum to that of China, which I estimate is between ~10moz and ~14moz. It is important to note that The Defense Logistics Agency Strategic Materials, U.S. Department of Defense reported no PGM sales in 2021. At year end, the National Defense Stockpile contained 15kg of Iridium, 261kg (around ~8,400oz) of Platinum, and less than 1kg each
of Palladium and Palladium-cobalt wire in 2021. This essentially means that almost all of North America’s stock is held by investors and industry including vehicle manufacturing conglomerates, etc.
As indicated, North America has by far the largest regional stock. I contend that North America will only dip into its “sticky” above-ground inventory at a price. Notwithstanding, I am of the opinion that these stocks will not support the increasing global demand for Platinum (and PEM green hydrogen) and will not nullify the increasing and continuous market deficit in Platinum, ceteris paribus.
Auctus Metal Portfolios Pte Ltd
Company Registration: 201828518M
23 Amoy Street, Singapore 069858
About Dr David Davis PhD. MSc. MBL. CEng. CChem. FIMMM. FSAIMM. FRIC
David has been associated with the South African mining industry and mining investment industry for the past 45 years (mainly PGM, gold and uranium). At present, David is working as an independent precious metal consultant. David’s PhD involved: “Studies in the catalytic reduction and decomposition of nitric oxide 1976”.
Important Notice
General Disclosures, Disclaimers and Warnings
This Report (“the report”) in respect of the global Platinum (PGM) industry is directed at and is being issued on a strictly private and confidential basis to, and only to, Professional Clients and Eligible Counterparties (“Relevant Persons”) as defined under the Investment Research Regulatory Rules and is not directed at Retail Clients. This report must not be acted on or relied on by persons who are not Relevant Persons. Any investment or investment activity to which this Report relates is available only to Relevant Persons and will be engaged in only with Relevant Persons.
The Report does not constitute or form part of any invitation or offer for sale or subscription or any solicitation for any offer to buy or subscribe for any securities in any Company discussed nor shall it or any part of it form the basis of or be relied upon in connection with any contract or commitment whatsoever.
The opinions, estimates (and where included) projections, forecasts and expectations in this report are entirely those of Dr David Davis as at the time of the publication of this report, and are given as part of his normal research activity, and should not be relied upon as having been authorised or approved by any other person, and are subject to change without notice. There can be no assurance that future results or events will be consistent with such opinions, estimates (where included) projections, forecasts and expectations. No reliance may be placed for any purpose whatsoever on the information or opinions contained in this Report or on its completeness and no liability whatsoever is accepted for any loss howsoever arising from any use of this Report or its contents or otherwise in connection therewith. Accordingly, neither Dr David Davis nor any person connected to him, nor any of his respective Consultants make any representations or warranty in respect of the contents of the Report. Prospective investors are encouraged to obtain separate and independent verification of information and opinions contained in the Report as part of their own due diligence. The value of securities and the income from them may fluctuate. It should be remembered that past performance is not necessarily a guide to future performance.
Dr David Davis has produced this report independently of the companies that may be named in this report except for verification of factual elements. Any opinions, forecasts, projections, or estimates or other forward-looking information or any expectations in this Report constitute the independent judgement or view of Dr David Davis who has produced this report (independent of any company discussed or mentioned in the Report or any member of its group).
The Report is being supplied to you for your own information and may not be reproduced, further distributed to any other person or published, in whole or in part, for any purpose whatsoever, including (but not limited to) the press and the media. The distribution of the Report in certain jurisdictions may be restricted by law and therefore any person into whose possession it comes should inform themselves about and observe any such restriction.
The Report has been prepared with all reasonable care and is not knowingly misleading in whole or in part. The information herein is obtained from sources that Dr David Davis considers to be reliable but its accuracy and completeness cannot be guaranteed.
Dr David Davis Certification
Dr David Davis attests that the views expressed in this report accurately reflect his personal views about the global Platinum Industry. Dr David Davis does not hold any interest or trading positions in any of the Companies mentioned in the report.


