USA Inflation Update
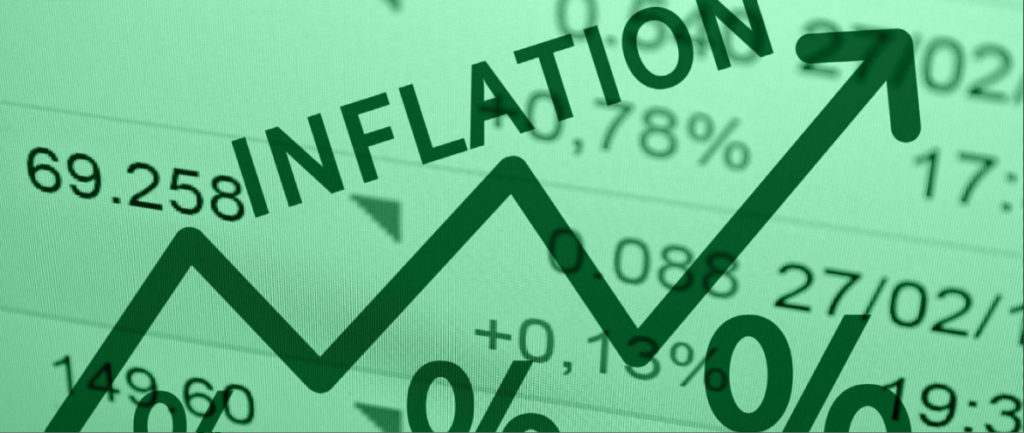
Inflation Surge Continues: June 2021 Annual Consumer Price Inflation (CPI-U) Hit a 13-Year High of +5.39%, just 0.21% shy of a 41 Year Peak since 1980. Or a Real Yield of -3.99% (10-Year US Bonds are trading at 1.40% minus +5.39% Inflation). Real Yield is the Nominal Yield of a bond minus the rate of inflation. Commentators on the news networks are now asking the very salient question: “are we at risk of experiencing 1970’s type inflation that drove precious metals dramatically higher”? The answer to this and for the edification of all of our clients is, we already have 1970’s inflation as the June ShadowStats Alternate CPI Measure hit +13.38%, which represents a 41 year peak! This equates to a Real Yield of -11.98%.
It is widely accepted, though not fully comprehended by the majority of investors around the world, that our governments have repeatedly manipulated the CPI (inflation) calculation methodology since 1980 to artificially suppress the headline inflation number. This is a wholly contrived ‘sleightof-hand’ required to ensure that inflation runs hot as we operate in a severe debt-based fiat monetary system. The debt needs to be constantly devalued and is achieved by actually debasing currency value which is done directly through inflation and which is essentially disguised through the ongoing manipulation of the data.
Definitions:
CPI-U (Consumer Price Index) as of 2021, is the broadest measure of consumer price inflation for goods and services published by the Bureau of Labor Statistics (BLS). ShadowStats Alternate CPI Measure: The CPI on the Alternate Data Series tab here reflects the CPI as if it were calculated using the same methodologies in place in 1980. In general terms, methodological shifts in government reporting have depressed reported inflation, moving the concept of the CPI away from being a measure of the cost of living needed to maintain a constant standard of living.
CYCLICAL TRENDS IN PRECIOUS METALS
An Extremely Positive Indicator by David J Mitchell, Founding Partner – Auctus Metal Portfolios
The overwhelming investment opportunity within the precious metals space can often be entirely lost on new investors. Even seasoned investors and existing clients can become
frustrated and risk losing sight of the fact that the revaluation in metals over next few years (substantially higher than today’s levels) is irreversible. Precious metal prices will be driven upwards by a tantalizing combination of real world capital flows, global industrial supply-demand dynamics, critical supply constraints and the truly mind-blowing impact and subsequent fall out from the global debt crisis which will result in the largest monetary debasement event recorded in economic history.
As such, and from a timing perspective in particular, a clear and well-defined understanding of precisely where we are in this present cycle is a necessity. Investors must ensure that they have a very clear understanding of what absolute, real returns they can expect over the next 3 to 4 years from an investment diversification into precious metals today.
The main and irrefutable drivers for the explosive price moves within this supercycle in commodities ahead are:
- The physical supply-demand tightness with supply deficits driven by the global industrial complex and capital investment flows.
- Severe multi-decade underinvestment across the commodity infrastructure.
- New and renewed portfolio diversification into the commodity sector causing a multiyear
spike in demand.
My view is that July is a key buying month with cycles moving higher into September, in line with CPM Group’s forecast for a sizeable end-of-year rally.
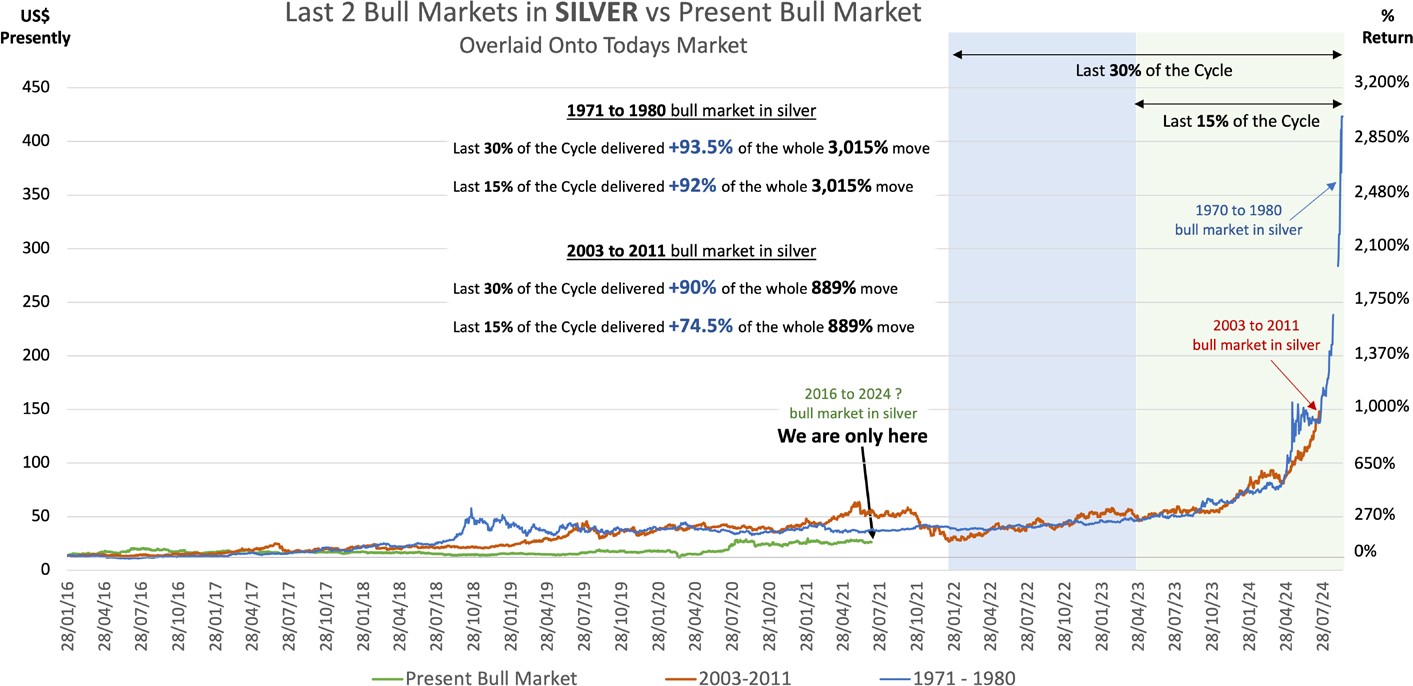
Using historical pricing data to empirically analyse what transpired during the last two major bull markets in metals between 1971 and 1980, and between 2003 and 2011, we can ascertain that over 90% of the overall price move in Silver, occurs in the last 30% of the cycle time frame. Since both of these most recent major bull markets were full Pi Cycles of equal length, i.e. 8.61 years, this gives us an extremely accurate indication of where exactly within the cycle we are today, given this particular cycle began in January 2016.
This is marked on the chart below:
Please take note, investors should not underestimate the importance of portfolio exposure to the precious metals at this juncture (especially considering the fundamentals, see Paul Tudor Jones interview lower in this article), as in 1970’s by the time it hit the ‘beginning’ of the last 30% of the cycle silver was already up by 200% and again the 2000’s bull market hitting the ‘beginning’ of the last 30% of the cycle silver was already up by 150%, presently silver is only up 100%, and I would suggest the foundations for this bull market is the most exciting we have ever seen, plus the economic backdrop today is the worst in modern history with a catastrophic global debt crisis.
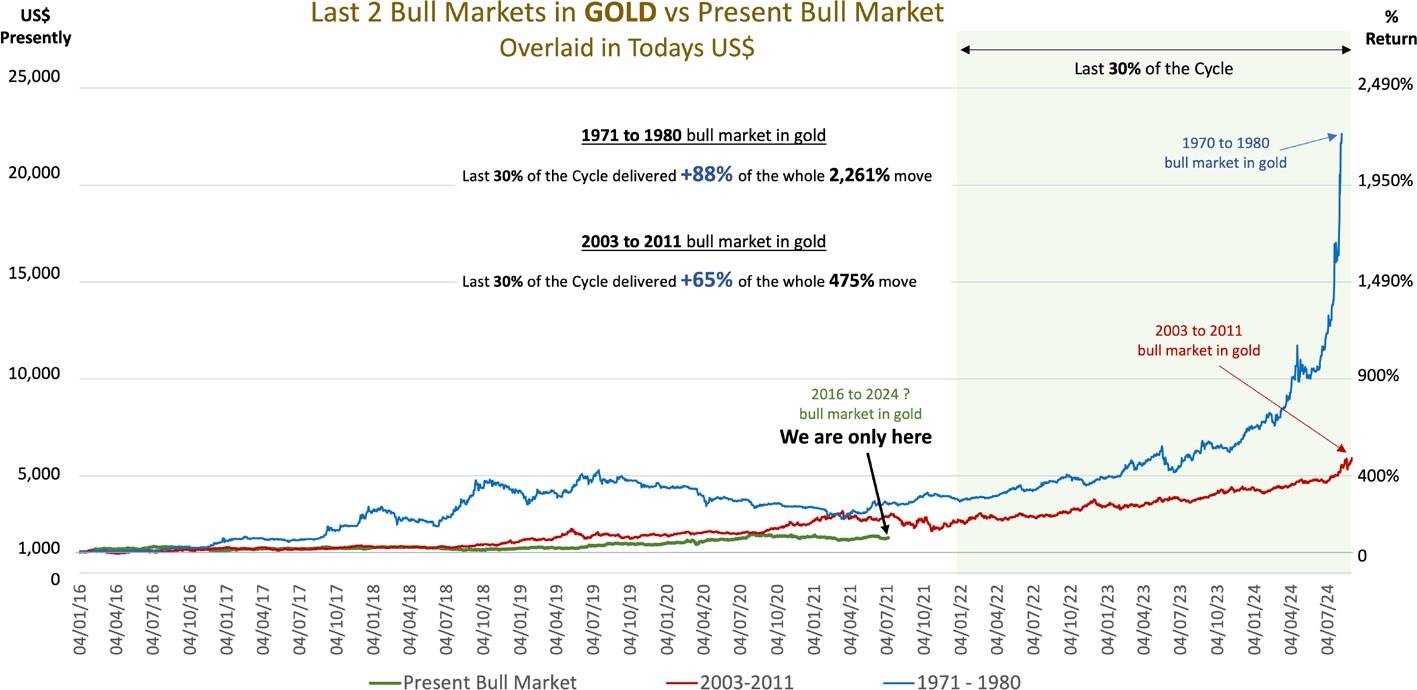
Similar price action within the aforementioned cycles can be seen with Gold. By overlaying the price movements throughout the last 2 Bull Markets in today’s US$ value; again this demonstrates that the last 30% of the cycle length (which commences later this year) delivered over +88% of the whole move of 2,261% from 1971 to 1980 and +65% of the whole move of 475% from 2003 to 2011. Truly outstanding opportunity!
The next 3 years for metal investors is going to be exceptionally exciting and tremendously rewarding as an asset class that provides not only great returns but also super liquidity from a traditionally defensive asset class that also ticks all of the boxes required to preserve wealth at this time.
Again, as in 1970’s by the time it hit the ‘beginning’ of the last 30% of the cycle gold was already up by a multiple 250% and the 2000’s bull market hitting the ‘beginning’ of the last 30% of the cycle gold was up by 160%, presently gold is only up 70%.
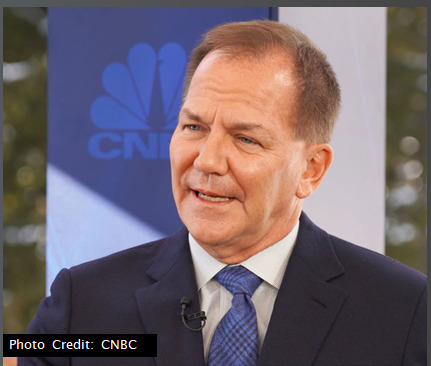
The wealth asset management community remains severely underweight in precious metals at this time and in a recent and rather rare interview in June 2021, Paul Tudor Jones (PTJ) – a hugely successful hedge fund billionaire, talks about the wonderful opportunity that the commodity and precious metals markets offers in 2021. A snapshot of his interview is detailed below.
The following is an extract from PTJ’s interview with CNBC:
The idea that inflation is transitory to me does not line up with the way I see the world. So, I look at US$88 trillion of assets that are managed by asset managers of which just US$670 billion are invested into commodity sectors, that’s about three quarters of just 1%.
If I rewind just to 2011 when inflation was peaking at 3%, (present CPI inflation hits 5.4%), those same investors had over 1.2% of their assets in the commodity sector, which would imply today if they
just matched their 2011 holdings then another $400 billion of buying into the commodity indices, and if you use the impact models that we run you see a doubling or tripling in value of these sectors.
I just look at where asset managers are, the one thing that they should be invested in, they’re not invested in, probably because they’re hearing these assurances that inflation
is transitory so you’ve got this effective massive short, really, in the commodity complex. Then we look at the supply-demand balances in a variety of commodities and they’re all so razor thin. What happens exactly when institutional money starts to invest where they should be, given the level of real negative rates?
What I mean is that commodities are in finite supply, very small markets generally speaking, and if we ever get an inflationary psychology, it’s the easiest tautology there is, these assets can literally scream double or triple with no problem whatsoever.
I think I’m the most conservative investor in the world, that’s a hedge fund manager by definition hates risk, loves edges, loves competitive edges, does great reward risk trades. I would be really concerned about arguing that inflation is transitory when I know that the opposite looks more rooted. Look, think about it, we have a global system with just in time inventory management replacement mentality, we have inventories at record lows, we have demand curves screaming and we have people who are really under-invested where they actually should be, especially given the extreme valuations of a variety of financial assets.
PLATINUM FUNDAMENTALS – MARKET UPDATE
Sibanye-Stillwater (the world’s largest primary producer of Platinum) remains very bullish on both Platinum and Rhodium but is cautious about Palladium as the deficit starts to slowly unwind.
• Sibanye is bullish on the prices of Platinum and Rhodium, which are used in the production of autocatalysts and anti-pollution devices in petrol and diesel engines, but it is more cautious on the outlook for Palladium, which is also used to make these exhaust devices.
• Due mainly to a growing trend of partially substituting Palladium with Platinum in the exhaust catalyst of petrol engines. This substitution will lead to demand for Platinum in petrol autocatalysts growing to 200,000 ounces this year and to between 1.5 million and
1.7 million ounces by 2025, said Sibanye CFO.
• The use of Platinum in hydrogen fuel cells, one of the leading green-energy / low-carbon solutions, will add further demand of 400,000 ounces per year by 2025.
Sibanye is bullish on Platinum. The opposite is true however for Palladium. Keyter notes that the substitution into Platinum combined with Norilsk Nickel ramping up Palladium production will bring the market balance into positive territory.
Sibanye anticipates an 800,000oz deficit in the Palladium market disappearing by 2024 which will consequently apply downward pressure on prices.
Mining Weekly/WPIC
• Platinum demand from the automotive sector is expected to be 25% up on 2020, reaching
almost three-million ounces this year, World Platinum Investment Council (WPIC)
• Partly attributed the projected increase to the Euro 6d and China 6a emissions regulations coming into force and being applicable to all vehicles sold in Europe and China respectively.
• China has been reported to have been in the market buying platinum, last reported bids below US$ 1,100 per Toz, they will continue to raise their buying interest on increased industrial demand.
• China 6 emission limits are more stringent than the limits currently in place in Europe and North America, making the increase in PGMs per car dramatic – as much as over 40% in most cases.
• Johnson Matthey expects PGM loadings on trucks that meet China VI requirements to be about three times higher than loadings for China V, with platinum accounting for most of this increase.
• That aside, China’s positive impact on platinum demand, from higher loadings on heavy- duty vehicles, combined with platinum substitution for palladium, is more significant than that from other markets.
• Some industry participants now project that, by 2025, as much as 1.5-million ounces of additional platinum will be used yearly to replace palladium in car and van models whereby first release predates the requirement to meet new emissions legislation, most likely in the North American market.
Where will the platinum come from to supply this demand?
