Precious metals continue to be an exceptionally undervalued asset class and attractive investment opportunity (with short-term cyclical sell-offs presenting excellent buying opportunities for investors).
A closer focus on 3 of the most liquid precious metals Silver, Platinum and Gold is very telling:
As far as our research can ascertain, Silver is the only commodity that is not only trading significantly below its 1980 highs (it is presently priced -50% below its 1980 peak; in present nominal US$ terms and not inflation adjusted US$ terms) and is also trading -50% lower than its 2011 peak. With inflation raging upwards, global money printing (quantitative easing and direct government debt expansion) reaching stratospheric levels and zero percent interest rate policies having been instigated for over 10 years now, it is very surprising to have a ‘real commodity’ trading at half the level it was trading at 41 years ago. This presents a very dynamic investment opportunity indeed.
- Silver is one of the most unique metals on the periodic table, being the most reflective metal on the planet.
- Silver has unique and well-documented anti-microbial properties, and has been demonstrated to effectively kill bacteria, fungi and certain viruses. It is the positively charged Silver ions (Ag+) that possess this antimicrobial effect. Again, no other metal on earth possesses these qualities.
- The most electrically conductive element is Silver, followed by Copper and Gold. Silver is considered to be the best conductor because its electrons are freer to move than those of the other elements, thereby making it more suitable for the conductivity of electricity and heat than any other element.
These entirely unique qualities are critical when considering the industrial demand for Silver which is rising, while at the same time, Global Industrial Mining Production Numbers have fallen every year since 2016 into the end of 2020.
The Gold-Silver-Ratio for Mine Production is currently 7.7 to 1 approximately, that is for every 1 ounce of Gold that is dug out of the ground, only 7.7 ounces of silver is mined. And yet the price is dealing as of today the 28th July (US$1,801/oz Gold / US$24.80 US$ Silver) = Gold-Silver-Ratio of 72.62
7.7 Gold/Silver Mine Production Ratio vs 72.10 Gold/Silver Price Ratio
Whilst one may surmise that ‘Mine Production Ratios’ for Gold & Silver are not important to ‘Price Ratios’, one should consider the scenario with Copper. Copper is an extremely important industrial metal just like Silver, and Copper mines produce both Silver and Gold. In fact, up to 70% of global Silver production comes directly from copper mines and Gold production is similarly a massive by-product of Copper mining.
- Global Copper production in 2020 was 20.1 million Metric Tonnes
- Gold production in 2020 was 3,200 Metric Tonnes.
Hence 20,100,000 / 3,200 metric tons offers a Gold-Copper Production Ratio of 6,281.25. Current Copper price: US$9,709 perton / 32,150.7 (Troy Oz’s in a Tonne) = 0.3020. Gold price is US$1,801/oz / 0.3020 = 5,963.58 Gold-Copper Price Ratio
Copper Price is trading at +5% above its Global Mine Production Ratio.
vs
Silver Price is trading at -90% below its Global Mine Production Ratio.
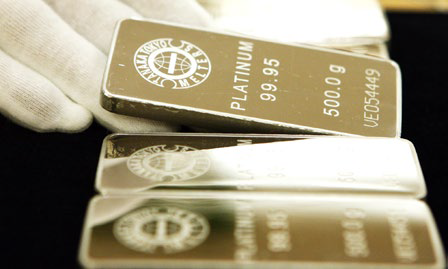
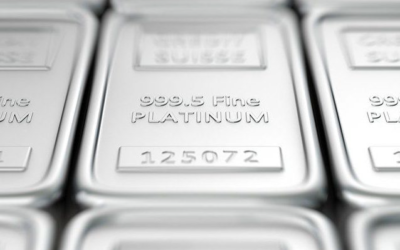
PLATINUM (Pt)
We know Platinum is an incredibly exciting story, with 80% of the world’s production coming from one failed state and one failing state; South Africa and Zimbabwe. South Africa’s economy is now plummeting to new lows and continues to be severely impacted by problems of extreme poverty, high unemployment, government and statewide corruption, the collapse of Eskom (the national electricity network) as well as growing civil unrest and escalations of rioting which have been well covered in the media and have resulted in 25,000 military troops being called in to help quash the unrest.
This imminent and long-term threat to the supply of Platinum is set against a sharp increase in demand for Platinum from the global industrial complex.
Platinum is trading at -50% below its 2008 peak in price, and more importantly than that, the global supply-demand deficit picture has moved into the red (a clear deficit). This deficit is expected to grow larger with every year moving forwards. The last time our research and models identified anything this spectacular from a supply-demand trade, was in Rhodium in 2016 when it was trading at US$750/oz. A very similar picture is emerging (to those presently identified with the clear and growing deficits in Platinum) with climbing demand and falling production. Many of our clients benefited enormously from this trade (+4,000%!) with the price in Rhodium rising to US$30,000/oz earlier this year. Whilst we do not expect to see such extraordinary returns in Platinum, we cannot underestimate the enormous potential.
GOLD (Au)
Over the last 10 years, Gold has risen a total of 8 out of the 10 years between 20 July and 5 September. This includes the bear market in Gold between 2011 and the end of 2015. During this distinct, short-term and cyclical time frame, investors in Gold have historically achieved the following returns over the last 10 years:
- Average Return of +5.21%
- Median Return of +6.85%
- Largest Return (in 2011) of +19.7%
Short term sell-offs and price manipulation must simply be considered as ‘noise’ and more importantly, they present massive opportunities for metal investors to load up on precious metals and further diversify at these considerable discounts. Revaluations in Silver, Platinum and Gold over the next 2 to 3 years are simply irreversible and we are very excited for our Auctus Metal Portfolio clients and the opportunity for substantial returns over this particular investment horizon.

