Platinum Analysis
(Ore Grades & South African PGM Mines’ Geological Structure) – Part II
by Dr. David Davis.

Introduction
This review continues the discussion mapped out in Part 1 ‘South African Platinum Mine Supply in Decline as Demand Gains Significant Traction’. The research focuses on the complexities (which I shall attempt to simplify) arising from the geological structure of the PGM reefs of one of the largest South African PGM mines. Comprehending such complexities enables investors to form a strategic overview of the many forces behind the the decline in PGM mine supply in South Africa.
This conversation describes unique characteristics of the Merensky, UG2, Platreef and the Prill Split. The purpose being, to unpack the complexities associated with the mining mix of the Merensky, UG2 and Platreef relative to the prices of Platinum, Palladium and Rhodium. A change in the mining reef mix ratio has and will continue to have a significant impact on the combined reef prill split and grade as well as the economic value.
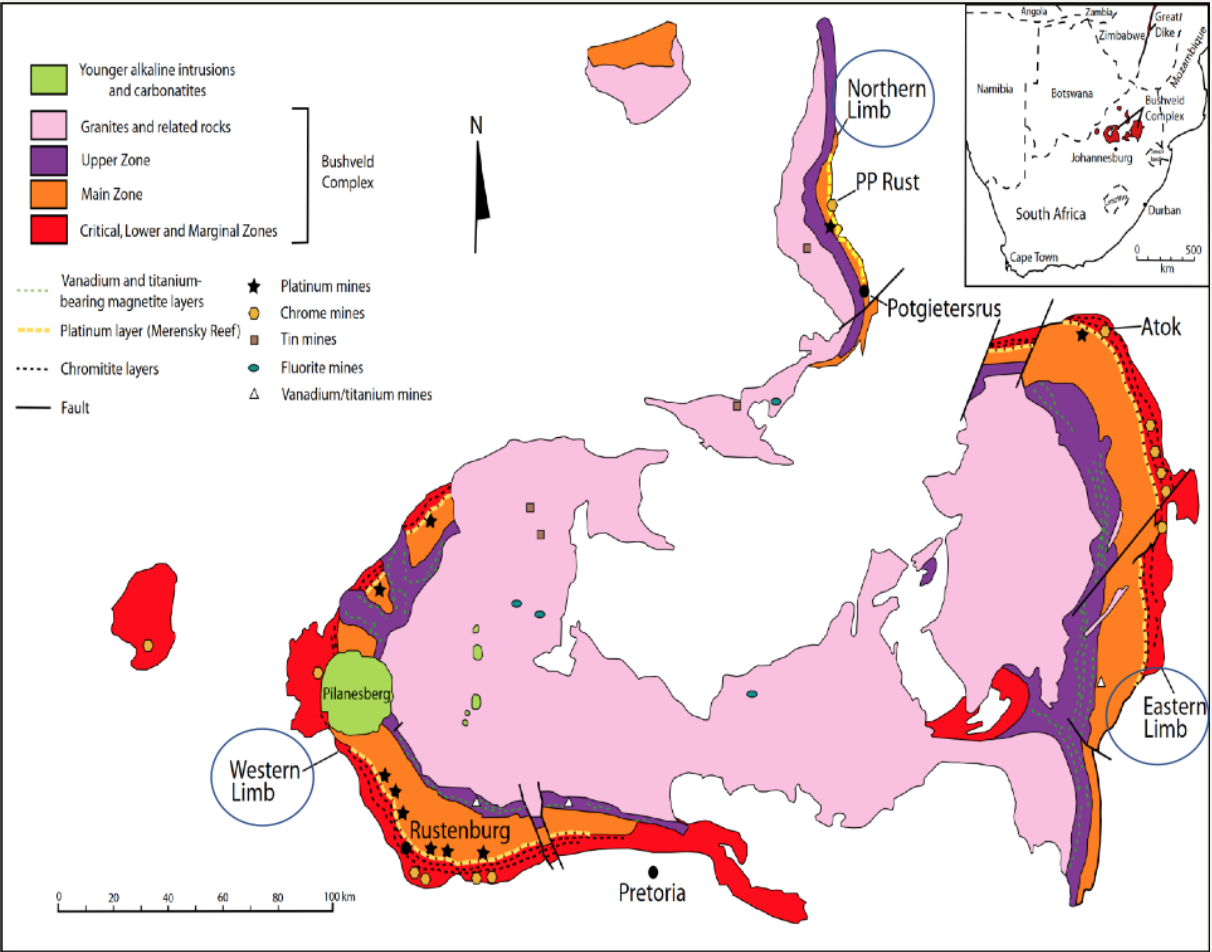
Platinum group metals (PGMs) occur exclusively within southern Africa and are concentrated between two distinct but unique ultramafic layered intrusions: the Bushveld Complex (BIC) in South Africa and the Great Dyke in Zimbabwe. A simple schematic of the BIC and the three distinct reef zones are illustrated in the graphic on the right.
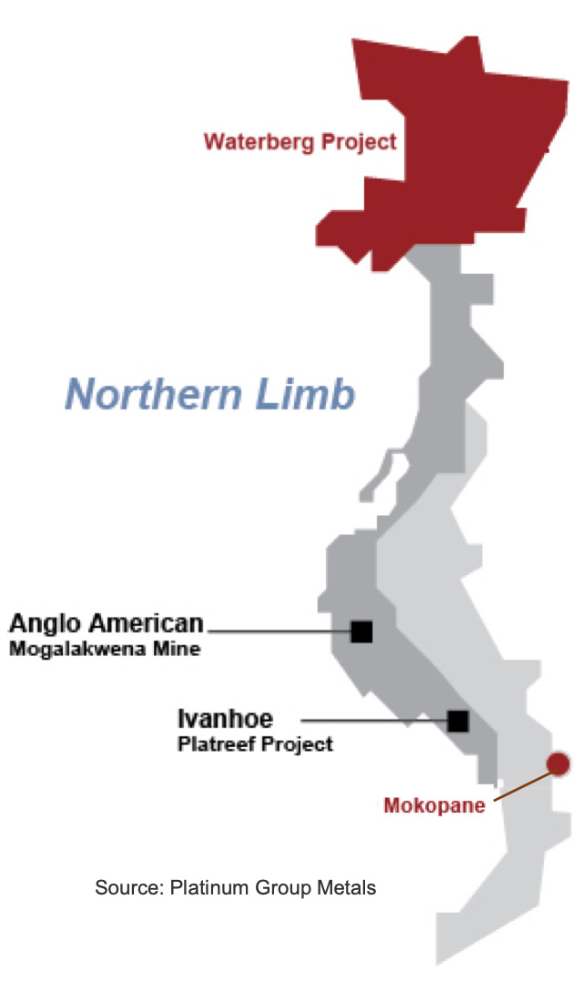
Economic concentrations of PGMs occur mainly within three distinct reefs within the BIC: The Merensky Reef; the Upper Group 2 (UG2) Chromite; and the Platreef. The Merensky and the UG2 reefs occur around the Eastern and Western limbs of the complex, while the Platreef is found only along the eastern edge of the Northern Limb.
Much of the Merensky Reef, which is Platinum rich, has been depleted on the Western limb; the UG2 reef is now the predominant reef which is mined on both the Western and Eastern limbs. The UG2 Reef is Palladium and Rhodium rich when compared to the Merensky Reef.
What is a PGM Prill Split?
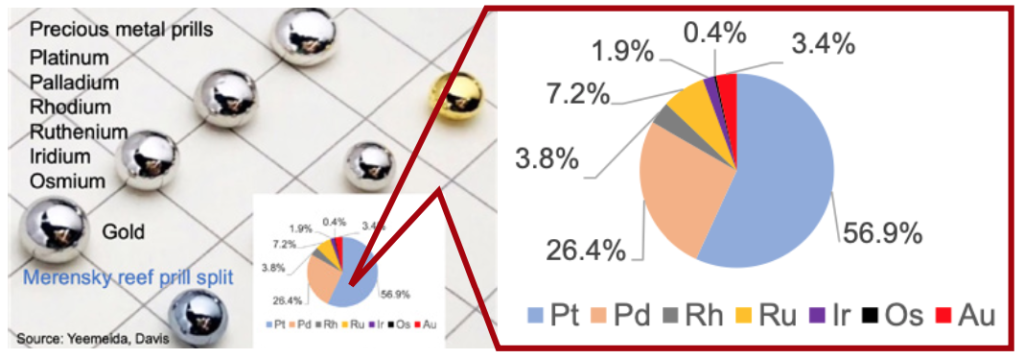
It is important to note that these distinct reefs are mined as a package of PGMs: Platinum, Palladium, Rhodium, Ruthenium, Iridium and Osmium plus Gold. The ratio and concentrations of PGMs within these three distinct reefs have a characteristic “PGM fingerprint” with regard to the relative ratios expressed as a percentage of the individual PGMs contained within different reefs. These ratios are commonly known as the PGM “prill split” in situ. The price and grade of the individual PGMs within the PGM package do, however take center stage, particularly when calculating the economic value of the reef mined.
It is important to note that the mining operations associated with these distinct reefs cannot be switched rapidly between reefs. However, the Merensky and the UG2 reefs are mainly mined concurrently. The ratio of the reef mix mined has changed from mining the Platinum-rich Merensky to mining larger quantities of Palladium and Rhodium-rich UG2, to compensate for a decline in the Merensky reserves and to satisfy global PGM demand. The graphic below represents a simplified view of precious metal prills obtained by a ‘fire assay’ procedure used in the analysis of a reef sample. Note, in reality the prill is minute in size. The weight of each prill is used to determine the percentage composition of PGMs in a reef sample.
The prill split, however, does not give an indication of the PGM grade nor an indication of the PGM mining reef mix ratio of Merensky to UG2 to Platreef. It is important to ascertain an estimate of the grade of each reef. Any trends in grade over time therefore becomes a useful tool in ascertaining the many reasons for the decline in Platinum supply from South African PGM mines.
A change in the mining reef mix ratio has a significant impact on the combined grade and prill split. For example, as indicated above, the Platinum-rich Merensky Reef reserves have been depleting over time, which has led to the increasing exploitation of UG2 (which is both Palladium and Rhodium rich) and the Platreef. The Platreef reserve grades are relatively low when compared to the reserve grades of the Merensky and UG2 reefs.
Unique Characteristics of the Merensky, UG2, Platreef and Prill Split
The objective of this section is to put into perspective the unique characteristics of the three main PGM reefs which occur in the BIC by illustrating graphically, the PGM prill split of each reef. This description is of fundamental and strategic importance regarding the future demand for Platinum, Palladium, Rhodium and Iridium. Other factors, which are equally important, are the grade and price.
The Merensky Reef was the principal source of PGMs from the time that it was first worked in 1925 until the end of the 20th century. However, the extraction of other reefs such as the UG2 and Platreef has grown in importance over time, and with the depletion of shallow Merensky resources by 2011, the Merensky Reef accounted for only 22% of the PGMs processed (Amplats). I estimate that the Merensky Reef now only accounts for around 11% of the PGMs mined in South Africa.
The exploitation of the UG2 Reef began in the 1970s and has steadily increased; with the increasing demand for PGMs. In 2011, UG2 Reef accounted for some ~63% of ore processed.
The Merensky Reef is characterised by relatively high quantities of Platinum ranging from around 54% to 66% and low quantities of Palladium. The contained Palladium ranges from around 26% to 35%, while the contained Rhodium ranges between 3% and 6% in the PGM plus Gold prill split.
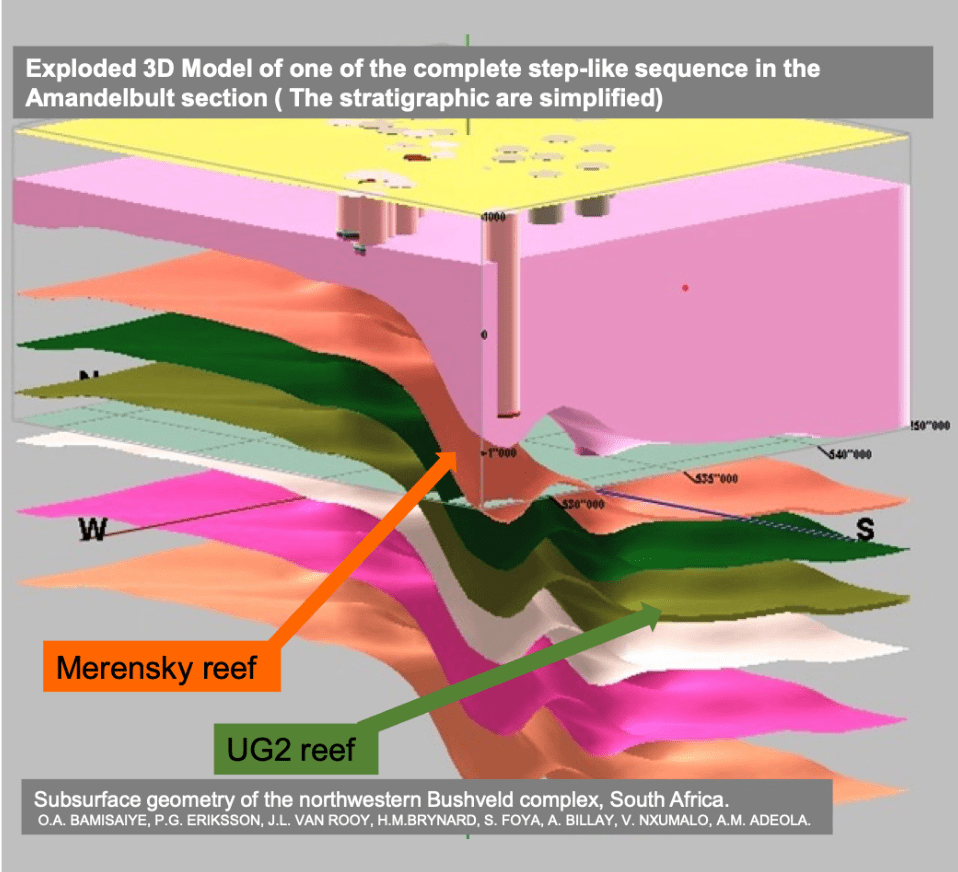
However, with the depletion of shallow Merensky resources the UG2 Reef (which is found at a vertical distance of 16m to 400m below the Merensky Reef) began to be exploited in the 1970s. Mining of the UG2 Reef has grown steadily in importance to the point where it now accounts, for approximately 68% of the PGMs mined in South Africa.
In comparison to the Merensky Reef, the UG2 Reef contains lower quantities of Platinum, but higher quantities of Palladium ranging from around 26% to 46% and Rhodium ranging from around 8% to 12%. UG2, however, also contains higher quantities of minor metals Ruthenium (12%), Iridium (1.8%) and Osmium (1.7%). The UG2 Reef contains Platinum and the highest proportion of Ruthenium and Iridium of any orebody worldwide, and the potential for higher prices for these minor metals is significant (SFA). It should be noted that the supply of Iridium and Ruthenium is almost entirely derived from the South African PGM mining industry, accounting for some 81% and 87% respectively of global production in 2020 (SFA).
The Merensky and UG2 reefs are narrow tabular orebodies that extend laterally over hundreds of square kilometres, resulting in extensive mineral resources. Their continuity, established over years of exploration and mining, allows for the long-range extrapolation of data. PGM grades do, however, vary within and between the three distinct reef zones of the BIC: Western, Eastern and Northam limbs.
Merensky and UG2 Projects
Sibanye Stillwater has two PGM projects underway: The long-life K4 brownfields project and the short-life shallow open pit UG2 Klipfontein project.
The K4 project will be designed to mine both Merensky and UG2 reefs to a depth of 1,287m. The project capex will be in the order of R4bn (US$261.2 m) and steady-state production of 4E 250koz is planned by 2030. With the Merensky UG2 ratio mix, I calculate that K4 should produce approximately 153koz of Platinum, 73koz of Palladium and 16koz of Rhodium by 2030.
The UG2 Klipfontein project will be mined to a depth of 45m, under a 50/50 JV with Amplats. Steady-state production of 37koz per annum is expected between 2022 and 2024 with production amounting to 4E 118.3koz over three years.
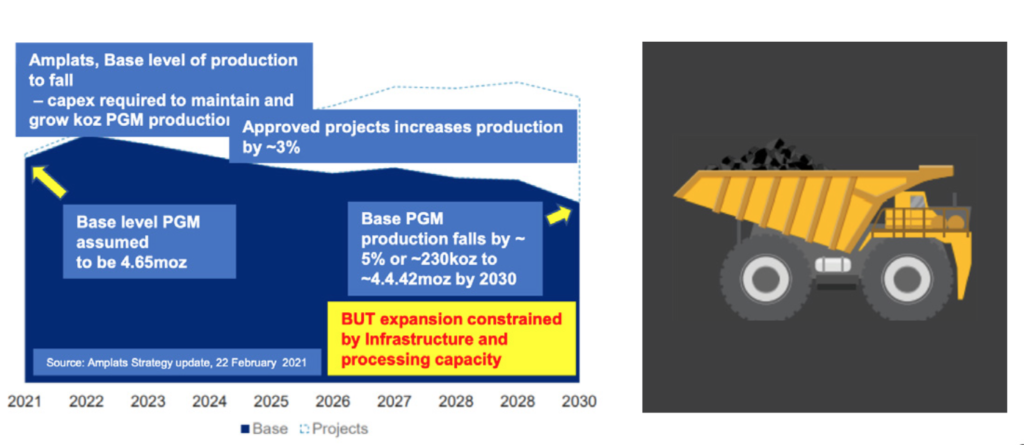
Amplats is transitioning towards a modernized and mechanized future on most of its mines. Amplats projects that at a base level from 2021, PGM production will decline by 5%. Approved projects are expected to increase production by 3%. Expansion is constrained by infrastructure and processing capacity, which will require additional capex.
In my view, the projects described above will unlikely stem the falling mine supply in the longer term.
The Platreef developed in the Northern Limb of the BIC comprises a thick heterogenous unit of mafic rock, dominated by pyroxenite and norite. The main layered mafic mass is known as the Platreef and hosts the important PGM deposits, with a Pt:Pd ratio of around 1:1 (approx. Pt 42%: Pd 46%). The Platinum and Palladium grades are relatively low when compared to the respective grades of the Merensky and UG2 reefs. Platreef, however, contains much reduced amounts of Rhodium (3%) and minor metals Ruthenium (4%), Iridium ($0.7%) and Osmium (0.7%).
In general, the economic thickness of the Platreef supports open-pit mining operations to depths exceeding 400m below the surface. In this regard, Anglo Platinum has developed a large, high volume open- pit mine, Mogalakwena, to mine the Platreef.
The Platreef also contains copper (0.2%) and nickel (0.3%), which are economically meaningful. The Platreef, briefly mined in the 1920s, was not exploited on a large scale until 1993.
I estimate that Platreef accounted for some 14% of PGMs mined in South Africa in 2021.
Platreef is gradually becoming a significant contributor of PGMs mined in South Africa, in particular for Amplats. Amplats is currently carrying out feasibility studies at Mogalakwena mine to optimise open-pit and concentrator design and create underground optionality. In this regard, Amplats is targeting expansion to achieve additional production of 300koz to 600koz of PGMs from current production levels of 1.2moz by 2030. An increase Platreef in the Merensky and UG2 mining mix will likely be detrimental to Amplats’ Rhodium production if throughput is constrained.
Platreef Projects:
There are two new mines on the Platreef horizon, the Waterberg project and the Ivanhoe Platreef project. Both projects are relatively small. The Waterberg project is expected to reach steady-state production of around 3E PGM plus Gold of 420koz by 2027, should financing be available. The Ivanhoe Platreef project plans an initial average annual production rate of 476koz PGM plus Gold. Note however, that details of the timing to reach steady-state production has yet to be announced; I would expect this date to be at least between 2027 and 2030. These mines are relatively small and will not likely take up the slack of ore reserve depletion, in particular Platinum reserves.

Southern African, Russian and North American PGM Prill Splits
The conversation in this section continues to focus on PGM reef prill splits. PGM ‘typical’ reef prill splits for South Africa, the Merensky, UG2 and Platreef and the MSZ reef in Zimbabwe together with the Russian and North American PGMs are illustrated as a pie diagram (see graphic). The relative ratios of Platinum, Palladium, Rhodium, Ruthenium, Iridium, Osmium plus Gold expressed as a percentage of the individual PGMs contained within different reefs. Source: Company reports SFA (Oxford), Dr. David Davis’ analysis and estimates.
Of note:
South Africa
- Merensky reef is Platinum rich and Palladium and Rhodium deprived when compared to the Platinum content.
- In comparison to the Merensky Reef, the UG2 Reef contains reduced quantities of Platinum, but higher quantities of Palladium and Rhodium. UG2 also contains higher quantities of minor metals Ruthenium, Iridium and Osmium. According to SFA, the UG2 Reef contains the highest proportion of Ruthenium and Iridium of any orebody worldwide, and the potential for higher prices for these minor metals is significant. It should be noted that the supply of Iridium and Ruthenium is almost entirely derived from the South African PGM mining industry, accounting for some 81% and 87% of global production respectively in 2020 (SFA).
- The Platreef has a Pt:Pd ratio of around 1:1. Platinum and Palladium grades are relatively low when compared to the respective grades of the Merensky and UG2 reefs. Unfortunately, Platreef contains much reduced amounts of Rhodium and minor metals Ruthenium, Iridium and Osmium.
Zimbabwe
- The Great Dyke is a 2.5-billion-year-old layered mafic-ultramafic body that intruded into Zimbabwe’s Archaean granites and greenstone belts. The Main Sulphide Zone (MSZ) of economically exploitable PGMs and associated base metal mineralisation, is located 10m to 50m below the ultramafic / mafic contact in the P1 pyroxenite, the PGMs, along with Gold, opper and iron-nickel occur in the MSZ. The reef contains some 47% Platinum and 37% Palladium.
The Darwendale project in Zimbabwe is being implemented by a Zimbabwean company, Great Dyke Investments, which is controlled on a parity basis by Russian and Zimbabwean shareholders. The Darwendale project is situated close to the Zimplats tenements. I am given to understand that the PGM ratios (prill split) between the two are very similar to Zimplats.
Darwendale ores are, however, a bit less favourable in terms of PGM content (lower ppm).
Phases 1, 2 and 3 of this project targets 280koz, 570koz and 860koz PGM respectively. Phase I is due to come on stream by mid-2022.
Phase 2 requires a concentrator upgrade and commissioning of a smelter.
Phase 3 requires a concentrator and smelter upgrade. I believe the build-up of the Darwendale project will likely be slower to come on stream than planned. I would, however, expect this date to be at least between 2027 and 2030.
North America
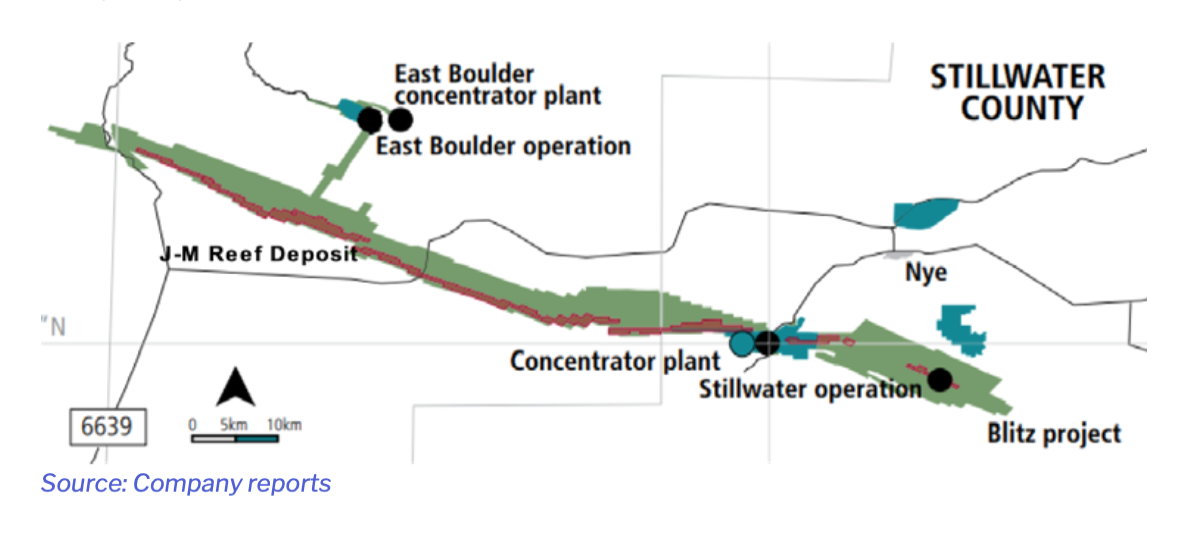
In 1973, Johns Manville International geologists discovered a high-grade PGM horizon (2PGE 14/t to 16g/t) and named it the J-M Reef at the Stillwater Complex.
The J-M Reef contains approximately 0.25% to 3% visible disseminated copper-nickel sulphide minerals, predominantly chalcopyrite, pyrrhotite and pentlandite, with microscopic amounts of PGM minerals and platinum-iron alloys. Copper, nickel, Gold and Rhodium are by-products of J-M Reef production. You will note that the J-M reef is heavily weighted towards Palladium (75%) and the Platinum content is much lower at around 23%.
Russia
-
Russia’s Norilsk Nickel is a diversified mining and metallurgical company, the world’s largest producer of refined nickel and Palladium and a leading producer of Platinum, Cobalt, Copper and Rhodium. The company also produces small quantities of Gold, Silver, Iridium, Selenium, Ruthenium and Tellurium. The orebody is heavily weighted towards Palladium (74%), the Platinum content is much lower at around 18%. It also contains much reduced amounts of Rhodium and minor metals Ruthenium, Iridium and Osmium.
Economic Value USD/t relative to Precious Metal Prices and Mining Reef Mix
In this section, I attempt to unpack the complexities associated with the mining mix of the Merensky, UG2 and Platreef relative to the price of Platinum, Palladium and Rhodium. A change in the mining reef mix ratio has a significant impact on the combined reef prill split and grade, together with the economic value.
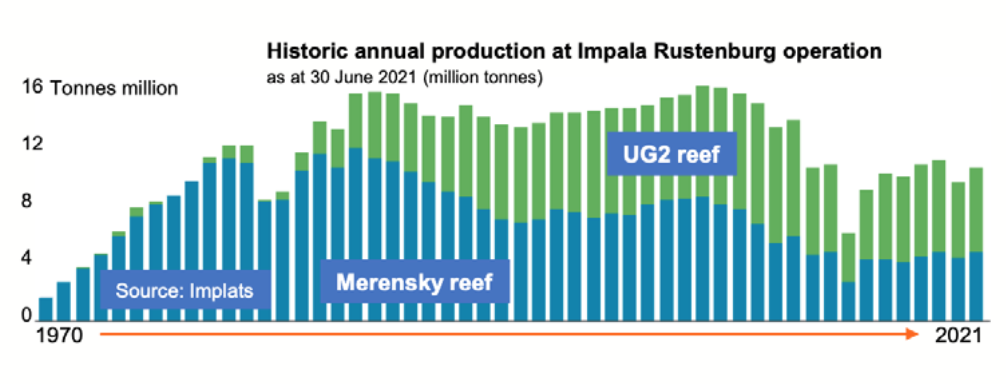
For example, the Platinum-rich high-grade Merensky reserves have been depleting over time, which has led to the increasing exploitation of UG2, which is Palladium and Rhodium rich. In this regard the reef mix has changed over time.
This graphic illustrates a change in the reef mix at Impala’s Rustenburg operations. The graph shows a decline in Merensky milled since 1970 compared to UG2 milled, which has a lower Platinum grade.
The change in mix will undoubtedly, in part, cause a decline in grade and in particular a decline in the Platinum grade since the platinum- rich Merensky grade is higher than the Platinum grade of UG2.
Economic value
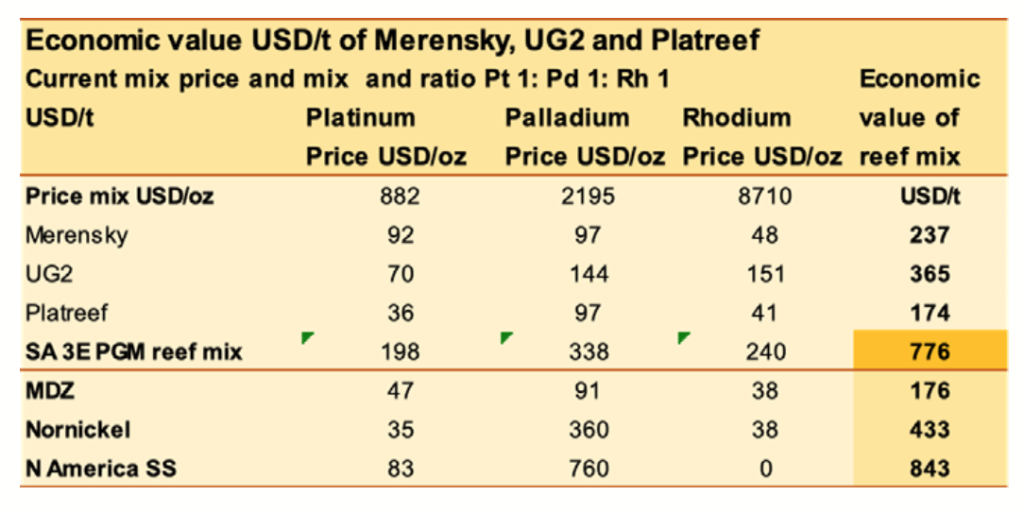
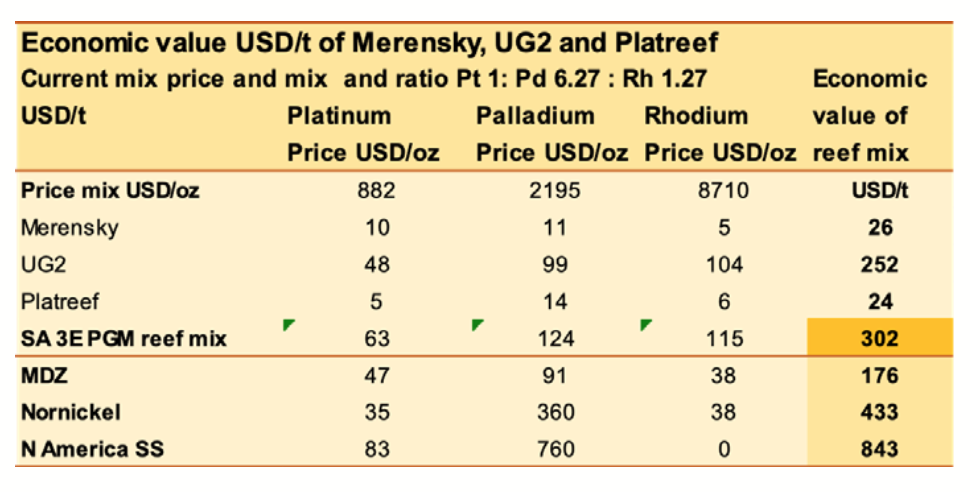
We note that the prill split determines the relative content of the PGM within the reef. The economic value, however, depends on the price of each PGM within the prill split. In this regard, the relative monetary value in USD/t of each of the individual components of the reef prill split may be calculated. The calculation used to determine USD/t includes two variables: the price and the grade. The tables below demonstrate the significant economic impact that a change in mining reef mix ratio has on the economic value.
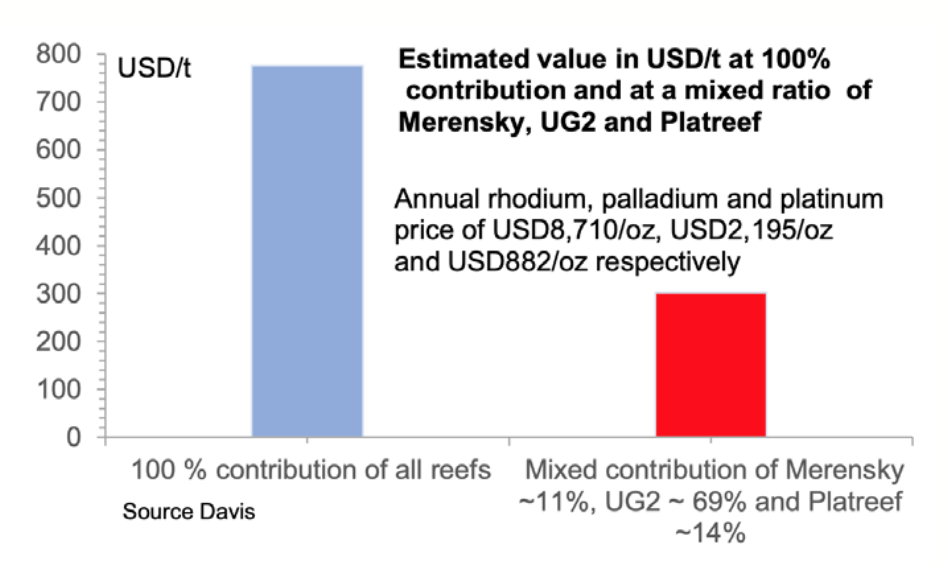
The first table below illustrates the economic value in USD/t of a mining mix of 1:1:1 Merensky, UG2 and Platreef respectively. This table offers an unlikely scenario, used only for the purposes of this demonstration. The table shows the value in USD/t of Merensky, UG2 and Platreef if all the reefs were mined as separate
entities at Platinum, Palladium and Rhodium prices of USD882/ oz, USD2,195/oz and USD8,710/oz per annum respectively. Under these circumstances, the value of a 1:1:1 ratio of Merensky, UG2 and Platreef was found to be USD/t: 237, 365 and 174 respectively. Under these circumstances, the approximate value of the composite reef mix ratio is USD/t 776.
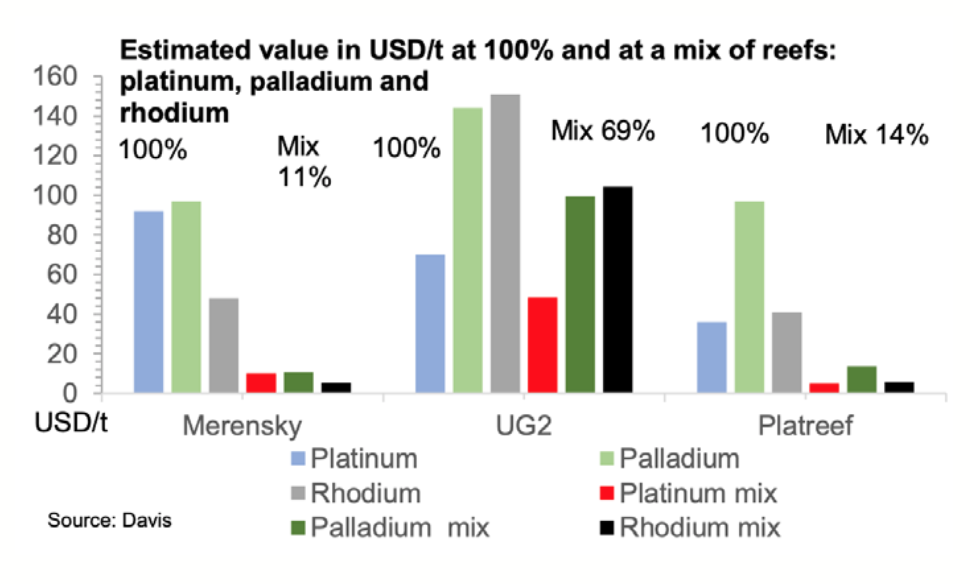
The USD/t value of Platinum, Palladium and Rhodium within each reef and the price set for each metal. For example, the first table shows that for Merensky the value of Platinum, Palladium and Rhodium is some 92, 97 and 48 USD/t respectively, amounting to a total of USD/t 237. Whereas, UG2’s economic values amounted to some 70, 144 and 151 USD/t respectively, amounting to a total of USD/t 356.
The second table returns to reality and uses a mining mix which, in my view, approximates the current mining reef mix. Under these circumstances, the calculations come with a caveat that needs to be taken into account. Nevertheless, I estimate the mining reef mix for Merensky, UG2 and Platreef to be 11%, 68% and 14% respectively.
The composite value of the reef mix ratio in this scenario was found to be USD/t 302. However, the contribution of Palladium and Rhodium from UG2 is significant. This value was accelerated by the recent skyrocketing prices as a result of market demand for Palladium and Rhodium. This situation has resulted in the South African mining industry delivering record profits over the past two years as UG2, a major component of all three reefs mined, is rich in Palladium and Rhodium.
This table also illustrates the economic value of the MDZ reef in Zimbabwe, Nornickel in Russia and Sibanye-Stillwater in North America as USD/t 176, 433 and 843 respectively.
The graphics on the right, further demonstrate the significant economic impact that a change in mining reef mix ratio has on the economic value and indirectly the grade. The graphics use the identical figures that were used in the tables above but are presented in a bar chart. The graphics give a striking visual demonstration of the impact of a change in mining mix at a spot price and a spot mining mix.
Clearly, the mining mix grade has moved to lower grades given UG2 and Platreef have lower grades than the Merensky Reef.
How has the Economic Value Progressed Over Time Compared to Metal Prices?
In the previous section, the discussion focused on a ‘snapshot’ methodology in an attempt to demonstrate the significant economic impact a change in mining reef mix ratio has on the economic value and by implication on the grade.
Economic value of PGM reef prill splits over time
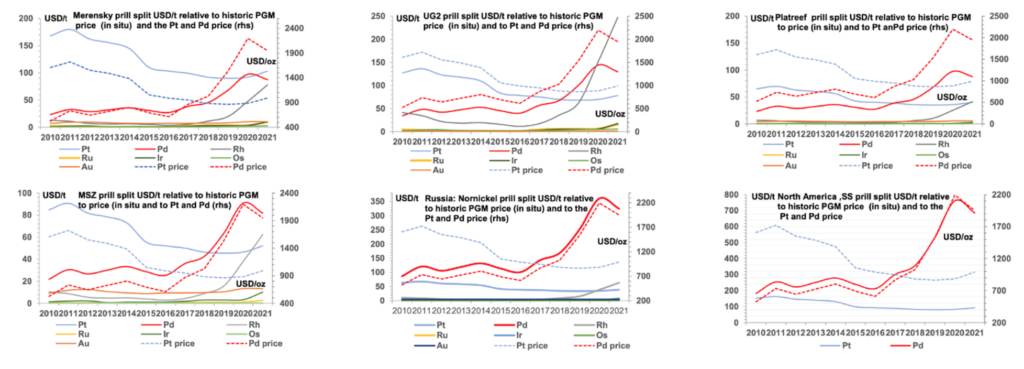
In this section, I present a set of graphics (below), which illustrate how the economic value of Platinum, Palladium and Rhodium together with their respective price changes, depending on the individual reef from 2010 to date (September 2020) for all of the mine reefs discussed above.
As an example, compare and contrast the economic value of the Merensky, UG2 and Platreef prill splits in 2011 and 2020. In 2011, the major driver of value was dominated by the Platinum-rich Merensky Reef. Higher demand stimulated higher Platinum prices while the price of Palladium and Rhodium remained low. The tables were completely turned towards the UG2 prill split reef around 2016, as the demand for Palladium and Rhodium increased, which spurred Rhodium and Palladium prices to dizzy highs, together with the economic value of UG2. The economic value of the Platreef prill split has relatively low economic value, due mainly to a significantly lower grade than Merensky and UG2. This reef supports high volume open-pit mining.
Both, Sibanye-Stillwater and Nornickel’s economic value benefited from the increasing price of Palladium as both orebodies are Palladium rich.
Merensky, UG2 and Platreef Reserve Grades
With an estimation of the reserve grade of Merensky, UG2 and Platreef over time, we attempt to pick up any trends in grade which would in part account for a decline in Platinum supply from South Africa. This objective is not easily determined since the reporting of reserves is not standard over time. This complexity presents a connundrum surrounding the determination of the time series of the grade of each reef.
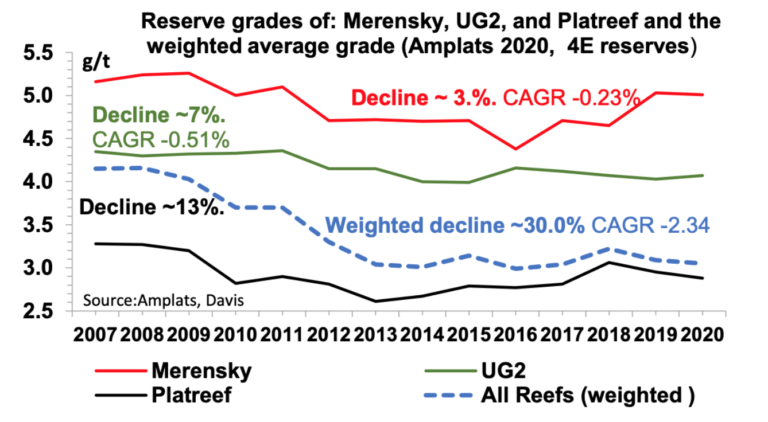
I have used a time series of the grade of the Amplats 4E proven and probable reserve grade as a proxy for the historic grades of Merensky, UG2 and Platreef (4E = Pt, Pd, Rh and Gold). Under these circumstances, the comparison between the grades of the reefs within the BIC with Amplats reserves should be viewed with an element of caution. Time series are important however, as they pick up long-term trends in grade. Furthermore, Amplats mines the Platreef, whereas the other PGM miners do not.
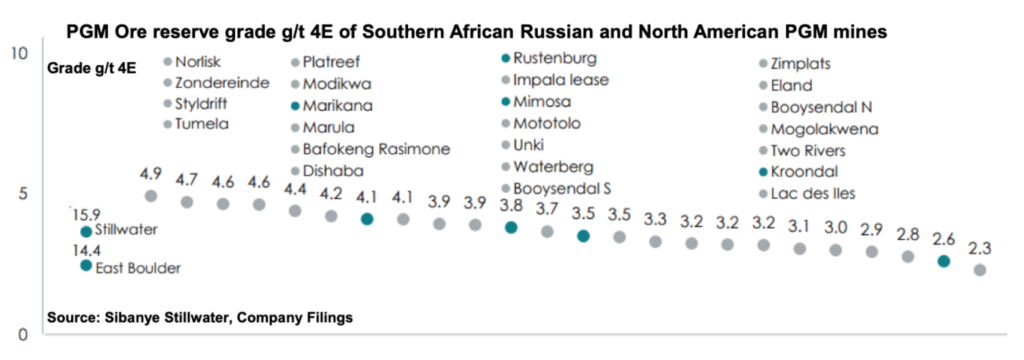
Sibanye-Stillwater published the graphic below in an Investor Relations presentation in October 2021. The graphic illustrates the PGM ore reserve grade g/t 4E for South African, Russian and North American PGM mines. In particular, illustrating that its US PGM operations are by far the highest grade in the industry.
It is important to note that the South African grades are likely to be the composite grade of the mining reef mix with regard to the ratio of Merensky to UG2.
Time Series of the Merensky, UG2 and Platreef Reserve Grades
The graphic below represents a time series of the Merensky, UG2 and Platreef reserve grades between 2007 and 2020. Of note, each reef has been in general decline over the past 13 years: Merensky -3%, UG2 -7% and Platreef -13%. The weighted average decline of -30% is attributed to the reserve tonnage Mt for each reef’s reserves respectively.
I note that on average the UG2 grade is some 19% lower (4.18g/t) than the average Merensky grade of 4.97g/t and some 68% lower than the average Platreef grade (2.96g/t), given the example presented.
Clearly, the ore reserve reef grades of the three reefs are declining.
In Summary
Throughout this research, I have attempted to describe the complexities and factors arising from the geological structure of the PGM reefs on South African PGM mines. I am of the clear view that this study is important to help investors put into perspective the ongoing decline of Platinum mine supply from South Africa and to understand the strategic longer-term view of Platinum mine supply from South Africa.
These factors include the declining grade of the three key reefs over time, the unequal depletion of reserves and the historical evolution of the mining mix ratio of the PGM reefs to higher mining ratios of the UG2 reef (which has lower Platinum grades when compared to the Merensky reef) are very telling. There are many additional factors which are likely to further accelerate the decline in Platinum supply, in particular the loss in PGM supply which will grow in line with South Africa’s looming energy crisis.

About Dr David Davis
PhD. MSc. MBL. GRIC. CEng. CChem. FIMMM. FSAIMM. FRIC.
David has been associated with the South African mining industry and mining investment industry for the past 45 years (mainly PGM, gold and uranium). At present, David is working as an independent precious metal consultant. David’s PhD involved: “Studies in the catalytic reduction and decomposition of nitric oxide 1976”.
Important Notice
General Disclosures, Disclaimers and Warnings
This Report (“the report”) in respect of the global PGM Industry is directed at and is being issued on a strictly private and confidential basis to, and only to, Professional Clients and Eligible Counterparties (“Relevant Persons”) as defined under the Investment Research Regulatory Rules and is not directed at Retail Clients. This report must not be acted on or relied on by persons who are not Relevant Persons. Any investment or investment activity to which this Report relates is available only to Relevant Persons and will be engaged in only with Relevant Persons.
The Report does not constitute or form part of any invitation or offer for sale or subscription or any solicitation for any offer to buy or subscribe for any securities in any Company discussed nor shall it or any part of it form the basis of or be relied upon in connection with any contract or commitment whatsoever.
The opinions, estimates (and where included) projections, forecasts and expectations in this report are entirely those of Dr David Davis as at the time of the publication of this report, and are given as part of his normal research activity, and should not be relied upon as having been authorised or approved by any other person, and are subject to change without notice. There can be no assurance that future results or events will be consistent with such opinions, estimates (where included) projections, forecasts and expectations. No reliance may be placed for any purpose whatsoever on the information or opinions contained in this Report or on its completeness and no liability whatsoever is accepted for any loss howsoever arising from any use of this Report or its contents or otherwise in connection therewith. Accordingly, neither Dr David Davis nor any person connected to him, nor any of his respective Consultants make any representations or warranty in respect of the contents of the Report. Prospective investors are encouraged to obtain separate and independent verification of information and opinions
contained in the Report as part of their own due diligence. The value of securities and the income from them may fluctuate. It should be remembered that past performance is not necessarily a guide to future performance.
Dr David Davis has produced this report independently of the companies that may be named in this report except for verification of factual elements. Any opinions, forecasts, projections, or estimates or other forward-looking information or any expectations in this Report constitute the independent judgement or view of Dr David Davis who has produced this report (independent of any company discussed or mentioned in the Report or any member of its group).
The Report is being supplied to you for your own information and may not be reproduced, further distributed to any other person or published, in whole or in part, for any purpose whatsoever, including (but not limited to) the press and the media. The distribution of the Report in certain jurisdictions may be restricted by law and therefore any person into whose possession it comes should inform themselves about and observe any such restriction.
The Report has been prepared with all reasonable care and is not knowingly misleading in whole or in part. The information herein is obtained from sources that Dr David Davis considers to be reliable but its accuracy and completeness cannot be guaranteed.
Dr David Davis Certification
Dr David Davis attests that the views expressed in this report accurately reflect his personal views about the global Platinum Industry. Dr David Davis does not hold any interest or trading positions in any of the Companies mentioned in the report.

